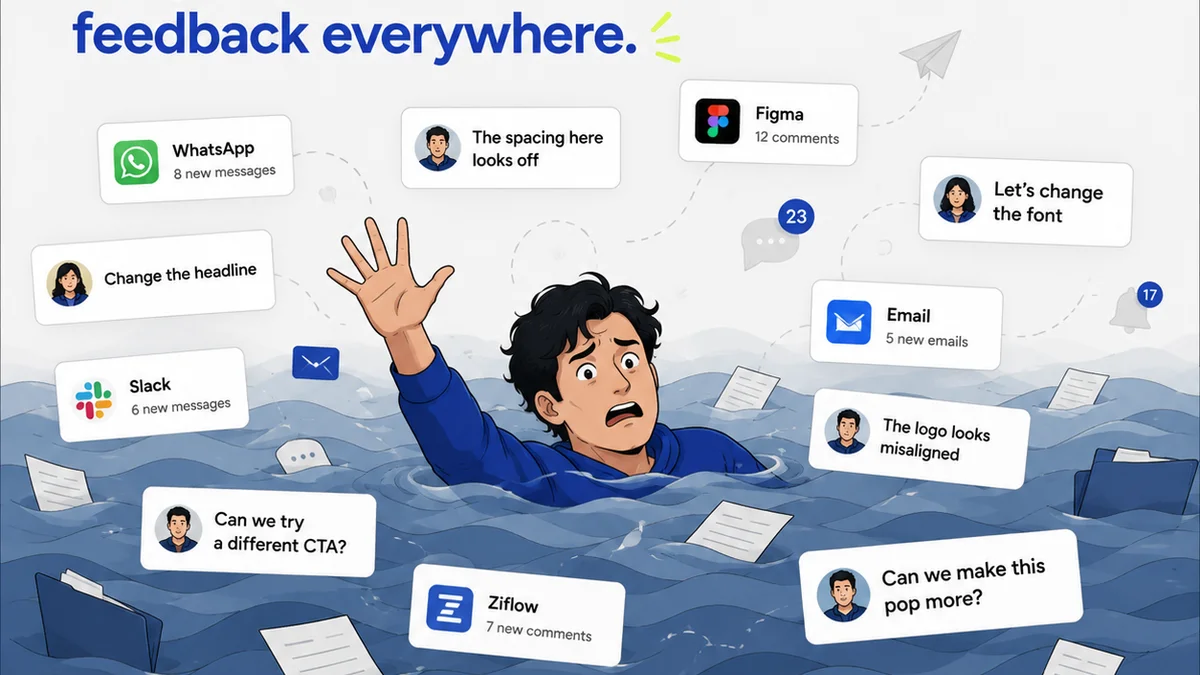
Everyone thinks a creative operations dashboard is about seeing what's on your plate. Project statuses, tasks due, client approvals pending. None of that is wrong. But it’s incomplete.
The real truth? Your creative ops dashboard isn't just a reporting tool. It's the nervous system of your entire agency. It needs to do more than just *show* work; it needs to *drive* it. It’s about proactive management, not reactive reporting.
1. The Assumption: Visibility Equals Control
You’ve probably heard that “what gets measured gets managed.” And it’s true, to an extent. A dashboard gives you visibility. You can see that Project X is stuck in review. You know that Designer Y is overloaded.
But visibility alone doesn't give you control. It just tells you *where* the problems are.
True control comes from understanding the *why* behind the status and having the tools to course-correct *before* things derail. It's about foresight, not just hindsight.
2. The Hard Truth: Your Dashboard is Your Agency's Central Nervous System
Think of your agency like a body. Projects are the limbs, tasks are the muscles, clients are the external stimuli. Your creative operations dashboard is the central nervous system. It receives signals, processes them, and directs responses.
A well-built dashboard doesn't just display data; it connects disparate parts of your workflow. It highlights bottlenecks, predicts potential issues, and enables swift, informed decisions.
It’s the difference between an agency that’s constantly firefighting and one that’s strategically navigating challenges.
3. Building the Core: Essential Dashboard Components
What makes a dashboard more than just a list of tasks? It’s about connecting the dots. Here’s what your core creative operations dashboard needs:
Project Health Overview
- Overall project status (On Track, At Risk, Off Track)
- Budget status (Within Budget, Approaching Limit, Over Budget)
- Timeline adherence (Ahead, On Time, Behind)
- Key milestones and their completion status
Resource Allocation and Capacity
- Team member workload (current and projected)
- Skill availability vs. project needs
- Identifying underutilized or overutilized resources
Client Feedback and Approval Tracking
- Number of feedback rounds per project
- Average time in client review
- Identifying clients who are habitual bottlenecks
- Status of outstanding client approvals
Financial Performance Indicators
- Project profitability
- Billable vs. non-billable hours
- Revenue forecasts based on project pipeline
Quality Assurance Metrics
- Number of revisions required post-launch
- Client satisfaction scores (if tracked)
- Internal QA pass rates
4. Beyond the Basics: Advanced Operational Insights
Once you have the core elements, you can elevate your dashboard. This is where you move from reporting to prediction and optimization.
Bottleneck Identification and Analysis
Don’t just see that a project is delayed. See *where* it’s delayed. Is it always during the design phase? Is it consistently with a specific client’s review process?
Your dashboard should flag these patterns:
- Commonality of specific task delays
- Frequency of specific team members being blocked
- Recurring delays tied to particular client types or individuals
Predictive Analytics (Even Simple Ones)
Can you predict when a project is likely to go over budget or miss a deadline? Use historical data.
If a project is X% over budget at Y% completion, what's the likely final outcome? If client feedback is taking Z days longer than average, flag it early.
Client Performance Tracking
Some clients are gold. Others are… challenging. Your dashboard can help quantify this.
- Track average turnaround time for feedback
- Monitor the number of revision cycles requested
- Note frequency of scope creep requests
This isn't about penalizing clients, but about understanding relationship dynamics and managing expectations proactively.
Resource Forecasting
Look ahead. Based on your current pipeline and project durations, when will you need more capacity in specific roles? When might your team have downtime?
This informs hiring decisions, training needs, and strategic business development.
5. Making it Actionable: From Data to Decisions
A dashboard full of pretty charts is useless if it doesn't lead to action. How do you ensure your insights translate into improved operations?
Real-time Alerts
Set up notifications for critical events:
- Project nearing deadline with pending tasks
- Budget threshold breached
- Client approval overdue by X days
- Resource allocation exceeding Y% for Z consecutive days
Integrated Workflows
Your dashboard shouldn't live in a silo. Can it trigger actions in other systems? For example, a project flagged as
Frequently asked questions
What are the key benefits of a creative operations dashboard?
A well-designed creative operations dashboard provides crucial visibility into project status, resource allocation, client feedback, and financial health. This allows for proactive problem-solving, better resource management, improved client communication, and ultimately, increased agency profitability and efficiency.
How can a dashboard help identify bottlenecks in my agency's workflow?
By tracking task durations, approval times, and resource utilization, a dashboard can highlight recurring delays. You can identify specific stages, team members, or even clients that consistently slow down projects, enabling targeted improvements.
Can a dashboard help with resource planning?
Yes. By analyzing current workloads and comparing them against historical project data and future pipeline projections, a dashboard can help forecast resource needs. This allows agencies to anticipate capacity gaps or potential downtime, informing hiring and allocation decisions.
What's the difference between a basic and an advanced creative operations dashboard?
A basic dashboard focuses on reporting current status (e.g., 'Project X is in review'). An advanced dashboard uses this data to provide deeper insights, such as predicting potential delays or budget overruns based on historical trends, identifying patterns in client feedback, and enabling more proactive decision-making.