Everyone talks about the creative operations dashboard. They say it’s the key to unlocking efficiency, streamlining workflows, and boosting profitability. It’s the silver bullet for agency chaos.
None of that is wrong. But it’s incomplete.
The hard truth? A dashboard is only as good as the data it displays and the actions it inspires. Without a clear understanding of what *really* matters, your dashboard becomes just another pretty screen.
1. Defining Your Core Metrics: What to Track
Before you even think about software, you need to define what success looks like for your agency. What are the critical indicators that tell you if your creative operations are healthy?
Too many agencies chase vanity metrics. They focus on things that look good on paper but don't drive real business results. We’re talking about things like total projects completed without considering profitability or client satisfaction.
Your dashboard needs to surface actionable insights, not just raw numbers. This means aligning your metrics with your agency’s strategic goals.
Key Performance Indicators (KPIs) for Creative Operations
- Project Profitability: Track profit margin per project, per client, and overall. This is non-negotiable.
- Resource Utilization: Understand how your team’s time is being spent. Are you over- or under-utilizing key talent?
- Client Satisfaction: Measure feedback systematically. Net Promoter Score (NPS) or client surveys are a start.
- On-Time Delivery Rate: Track projects delivered by their deadline. Understand the reasons for delays.
- Revision Cycles: Monitor the number of revisions per project. Excessive rounds often indicate scope creep or unclear feedback.
- Team Capacity & Burnout: Keep an eye on workloads. Are individuals consistently overloaded?
These aren't just numbers. They are signals.
Signals about where you're winning, and more importantly, where you're bleeding money or talent.
2. Operational Visibility: Seeing the Whole Picture
A true creative operations dashboard provides end-to-end visibility. It connects the dots from initial brief to final invoice.
Most agencies operate in silos. Sales hands off a project, creative starts work, account management chases feedback, finance invoices. Each step is a potential point of failure, a black box where things can get lost or delayed.
Your dashboard should break down these silos. It should show you the flow of work, identify bottlenecks, and highlight potential risks *before* they become crises.
Essential Dashboard Views
- Project Pipeline: Visualize all active projects, their status, deadlines, assigned teams, and budget.
- Resource Allocation: A clear view of who is working on what, their availability, and upcoming capacity.
- Financial Health: Real-time insights into project budgets, actual costs, and projected profitability.
- Client Communication History: A centralized log of feedback, approvals, and key decisions.
- Task Management Overview: See task progress, identify overdue items, and understand dependencies.
This isn't about micromanagement.
It’s about informed decision-making.
It’s about steering the ship with a clear view of the horizon, not just the bow.
3. Bottleneck Identification: Where Work Gets Stuck
The most valuable function of a creative operations dashboard is its ability to pinpoint exactly where your workflow is grinding to a halt.
Think about it. Where do projects typically get delayed? Is it waiting for client feedback? Is it waiting for a specific team member’s availability? Is it stuck in a lengthy internal review process?
Without a dashboard, these bottlenecks are often invisible or attributed to vague issues like “project complexity.”
A good dashboard surfaces the *real* reasons.
Common Bottlenecks to Watch For
- Waiting for Client Feedback: Projects stalled because stakeholders are slow to respond.
- Internal Review Loops: Excessive back-and-forth between internal teams before client delivery.
- Resource Conflicts: Multiple critical projects competing for the same limited resources.
- Scope Creep: Uncontrolled expansion of project requirements leading to delays and budget overruns.
- Inefficient Handoffs: Poorly documented or unclear transitions between project phases or teams.
Once identified, these bottlenecks can be addressed systematically.
You can implement new processes, train your team, or even have tougher conversations with clients.
4. Resource Management: Optimizing Your Team's Time
Your team is your most valuable asset. A creative operations dashboard should help you leverage their talent effectively without burning them out.
Many agencies operate on a reactive basis for resource allocation. When a new project comes in, they scramble to find someone available. This often leads to suboptimal assignments and overworked staff.
A proactive approach, powered by data, changes everything.
Key Resource Management Insights
- Capacity Planning: Forecast future resource needs based on your project pipeline and team availability.
- Skill Matching: Ensure the right people are assigned to the right tasks based on their expertise.
- Workload Balancing: Distribute tasks evenly to prevent burnout and maximize productivity.
- Time Tracking Accuracy: Reliable time tracking data is the foundation for accurate utilization and profitability reporting.
- Identifying Skill Gaps: See where your team consistently needs external support or training.
This isn't about squeezing every last second out of your team.
It’s about smart allocation. It’s about ensuring everyone is working on the most impactful tasks, at a sustainable pace.
5. Financial Tracking: Profitability at Your Fingertips
Let's be blunt: if your agency isn't profitable, nothing else matters.
Creative operations dashboards that ignore financials are missing the most critical piece of the puzzle. You need to know, in real-time, how projects are performing against their budgets.
This means moving beyond simple timesheet entries to a more integrated view of costs, billable hours, and project value.
Financial Metrics That Matter
- Budget vs. Actuals: Constant comparison of planned expenses and time against real-time spending.
- Projected Profitability: Forecasted profit based on current progress and remaining scope.
- Billable vs. Non-Billable Hours: Understanding where team time is being spent and its impact on revenue.
- Invoice Status: Clear visibility into what has been invoiced and what payments are outstanding.
- Client Budget Burn Rate: How quickly is the client’s budget being utilized?
This data allows you to make immediate adjustments.
You can identify projects that are going off the rails financially and intervene before it’s too late.
6. Where Revue Fits In
A comprehensive creative operations dashboard provides a single source of truth for all project-related data. It connects the dots between feedback, revisions, approvals, and quality checks.
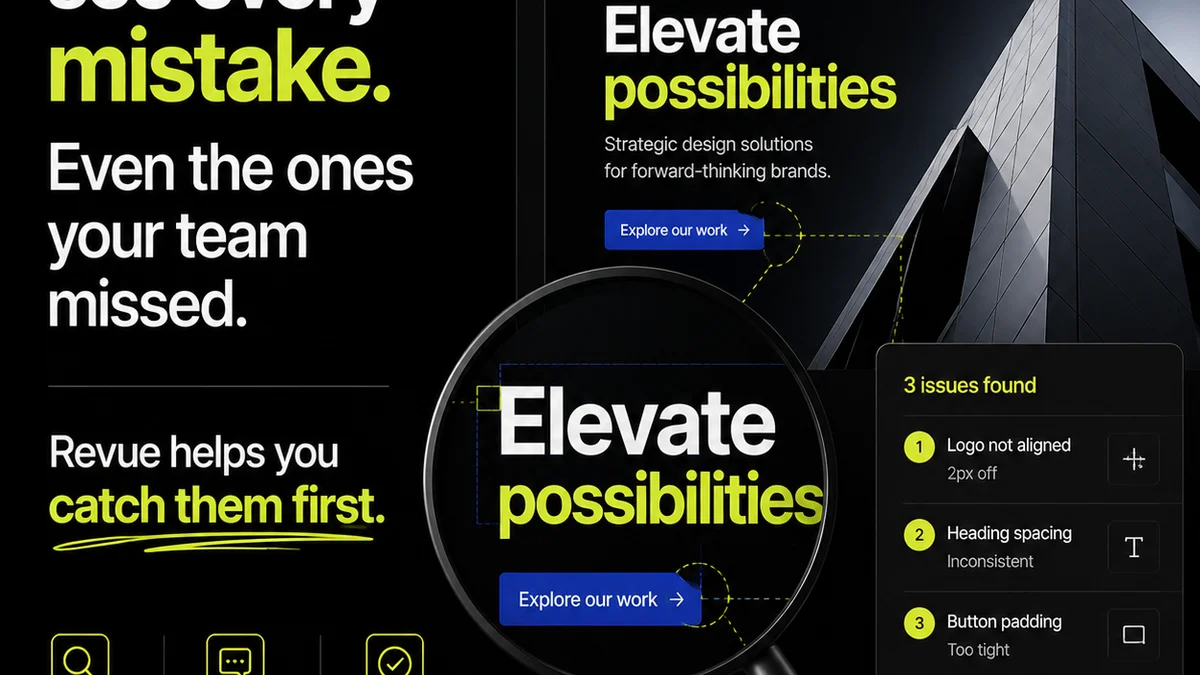
When you centralize client feedback within a platform like Revue, you eliminate ambiguity. Every comment, every annotation, every approval decision is logged and tracked.
This structured data flows directly into your operational view. You can see:
- Revision History: How many rounds of revisions has a project undergone? Who requested them?
- Approval Status: Which assets are approved? Which are pending? Who needs to sign off?
- Feedback Clarity: Are clients providing clear, actionable feedback, or is it vague and subjective?
- Quality Control: Are final assets meeting the agreed-upon specifications before delivery?
Revue transforms unstructured feedback into structured data points. These points feed directly into the metrics and visibility you need for a powerful operational dashboard.
It’s not just about collecting feedback; it’s about making that feedback work *for* your operations.
7. Building Your Checklist: Implementation Steps
So, how do you get from a pile of spreadsheets and gut feelings to a truly functional creative operations dashboard?
It’s a process. It requires commitment.
- Define Your Goals: What problems are you trying to solve? What do you want to achieve?
- Identify Key Stakeholders: Who needs access to this data? Who will use it to make decisions?
- Audit Your Current Tools: What systems are you using now? Can they be integrated?
- Select Your Metrics: Based on your goals, choose the 5-7 most critical KPIs. Start simple.
- Choose Your Platform: Will you build a custom dashboard, use BI tools, or leverage features within your existing project management software?
- Implement Data Collection: Ensure accurate and consistent data input from all teams. This is often the hardest part.
- Train Your Team: Everyone needs to understand how to use the dashboard and why the data matters.
- Review and Iterate: Your dashboard is not static. Regularly review its effectiveness and make adjustments.
Don’t try to boil the ocean.
Start with the essentials and build from there.
Final Thought
A creative operations dashboard isn't a magic wand. It's a tool. A powerful tool, yes, but still just a tool.
The real magic happens when you use the insights it provides to make smarter decisions, foster better communication, and build a more resilient, profitable agency.
What data are you currently tracking, and how is it truly impacting your agency’s operations?
Frequently asked questions
What is the primary benefit of a creative operations dashboard?
The primary benefit is gaining real-time visibility into key performance indicators, allowing for data-driven decision-making, bottleneck identification, and improved resource and financial management within a creative agency.
What are the most important metrics to include on a creative operations dashboard?
Crucial metrics include project profitability, resource utilization rates, on-time delivery rates, client satisfaction scores, and the number of revision cycles per project. Financial tracking like budget vs. actuals and projected profitability is also essential.
How can a dashboard help identify workflow bottlenecks?
By tracking project progress and time spent at each stage, a dashboard can highlight where tasks are consistently delayed or where resources are over-allocated, pinpointing specific bottlenecks like slow client feedback or internal review loops.
Can a dashboard help improve team workload balance?
Yes, by providing a clear overview of current and upcoming tasks assigned to each team member, a dashboard allows managers to identify overloaded individuals and reallocate work to ensure a more balanced and sustainable workload, preventing burnout.
How does Revue contribute to a creative operations dashboard?
Revue centralizes client feedback, revision tracking, and approval status, transforming this unstructured data into quantifiable metrics. This information feeds directly into a dashboard, providing visibility into revision cycles, approval bottlenecks, and feedback clarity.