Everyone talks about creative operations metrics. They say you need to track project timelines, budget adherence, and client satisfaction. None of that is wrong. But it’s incomplete.
The hard truth is that most agencies are tracking the *wrong* metrics, or they're tracking the *right* ones in isolation, leading to a distorted view of reality. You end up optimizing for vanity numbers that don't actually move the needle on profitability or team sanity.
Real creative operations success isn't just about delivering on time and on budget. It's about building a predictable, scalable, and profitable engine that consistently produces high-quality creative work without burning out your best people.
This checklist goes beyond the obvious. It focuses on the operational metrics that reveal the true health of your creative business.
1. Project Velocity & Throughput
This is about how quickly and consistently work moves through your system. It’s not just about hitting deadlines; it’s about understanding the flow.
Cycle Time
How long does it take for a project (or a specific phase) to go from kickoff to final delivery? Shorter cycle times mean faster revenue recognition and quicker client wins. Analyze this by project type, client, or even team member.
Throughput
How many projects (or deliverables) does your team complete in a given period? This helps you understand your capacity and identify bottlenecks. Are you consistently hitting your throughput targets, or are projects piling up?
Work in Progress (WIP) Limits
This isn't a metric you track retrospectively, but a rule you implement. Limiting WIP prevents context switching and ensures focus. A common assumption is that more projects running simultaneously equals more productivity. The opposite is true. Overloaded teams are slow teams.
Key Questions:
- What is the average cycle time for our top 3 service offerings?
- Are we seeing a trend of increasing or decreasing cycle times?
- What is our current weekly/monthly throughput?
- Where do projects typically get stuck?
2. Resource Allocation & Utilization
Are your most valuable assets—your people—being used effectively and efficiently?
Billable vs. Non-Billable Hours
This is a classic, but crucial. What percentage of your team’s time is spent on client work versus internal tasks, admin, or training? A healthy agency typically aims for a high billable utilization rate, but not so high that it leads to burnout or neglects essential business development.
Resource Load Balancing
Are certain individuals or teams consistently overloaded while others are underutilized? This isn't just an efficiency problem; it's a morale and retention issue. Effective resource management ensures work is distributed fairly and sustainably.
Skill Utilization
Are your designers doing design work? Are your strategists doing strategy? Misaligned skills lead to lower quality, longer timelines, and disengaged employees. Track if people are working within their core competencies.
Key Questions:
- What is our overall billable utilization rate?
- Which roles or teams have the highest/lowest utilization?
- Are there specific periods where utilization spikes or dips dramatically?
- How does skill utilization align with project needs?
3. Profitability & Financial Health
This is where the rubber meets the road. Are your operations actually making you money?
Project Profitability
This goes beyond just tracking budget vs. actual spend. It’s about understanding the *true* profit margin for each project. Did the project deliver the expected profit after accounting for all direct and indirect costs, including overhead?
Client Profitability
Which clients are your most profitable? Which are your least? This analysis helps you make strategic decisions about client acquisition and retention. It’s often more profitable to do more work for good clients than to constantly chase new, potentially less profitable ones.
Cost of Goods Sold (COGS) for Services
For agencies, this includes direct labor costs, software licenses directly tied to projects, and any third-party services used. Understanding your COGS is fundamental to accurate pricing and profit calculation.
Key Questions:
- What is the average profit margin across all projects?
- Which clients contribute the most to our bottom line?
- Are our pricing models accurately reflecting our costs and desired profit margins?
- How do project scope creep and revision rounds impact profitability?
4. Quality & Client Satisfaction
Happy clients and high-quality work are the bedrock of a sustainable agency.
Error Rate / Rework Percentage
How often does work need to be redone due to internal errors or missed requirements? A high error rate indicates process flaws, inadequate quality control, or poor communication.
Client Feedback Scores (NPS, CSAT)
While subjective, consistent tracking of client satisfaction provides invaluable qualitative data. Look for trends and dig into the 'why' behind the scores.
Internal Quality Assurance (QA) Pass Rate
What percentage of work passes internal QA checks the first time? This is a direct indicator of your team's adherence to standards and processes before work even gets to the client.
Key Questions:
- What is our internal QA pass rate?
- What are the most common reasons for client revisions or dissatisfaction?
- How do our client satisfaction scores correlate with project profitability?
5. Team Health & Morale
Your team is your greatest asset. Metrics here are less about numbers and more about understanding the human element.
Employee Turnover Rate
High turnover is expensive and disruptive. It often signals underlying issues with workload, management, or culture.
Team Feedback / Pulse Surveys
Regular, anonymous check-ins can reveal team sentiment, identify burnout risks, and surface process pain points that might not appear in other metrics.
Overtime Hours
A consistent pattern of overtime is a red flag for unsustainable workloads or inefficient processes. It’s a direct drain on profitability and a fast track to burnout.
Key Questions:
- What is our employee turnover rate, particularly among key creative roles?
- Are there specific teams or projects associated with higher overtime?
- What are the recurring themes in team feedback regarding workload and processes?
Where Revue Fits In
Collecting these metrics can feel overwhelming. You need systems that capture the data without adding more manual work. That’s where a platform designed for creative operations becomes essential.
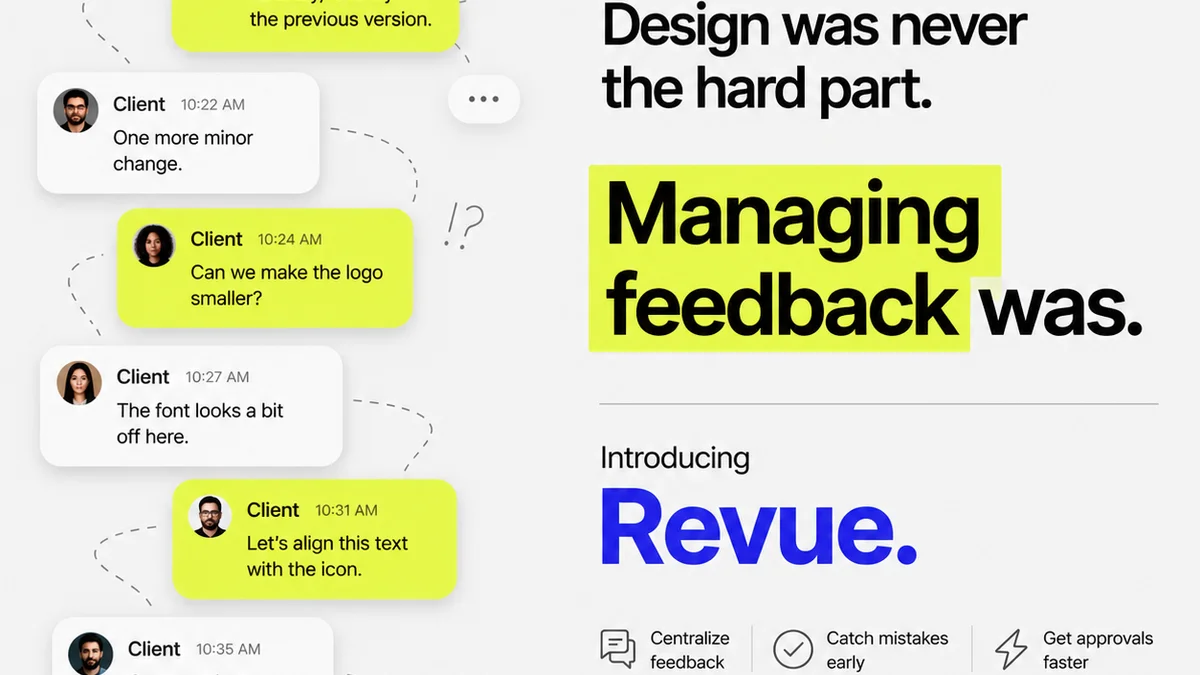
Revue centralizes client feedback, making it easier to track comments, revisions, and approvals. This directly impacts your cycle time and rework percentage metrics.
By providing a clear audit trail of feedback and approvals, Revue minimizes misunderstandings and reduces the back-and-forth that bloats project timelines and eats into profitability.
The visibility into revision rounds helps you identify scope creep early, allowing you to manage client expectations and protect your project profitability and resource allocation.
Ultimately, streamlining these processes means less friction for your team, contributing positively to team health and reducing unnecessary overtime.
Final Thought
Are you measuring what truly matters? Most agencies focus on output—delivering the work. The best agencies focus on the *system* that produces the work. By implementing a creative operations metrics checklist that looks beyond the surface, you gain the insights needed to build a more efficient, profitable, and resilient creative business.
What's the one metric you'll start tracking this week to improve your operations?
Frequently asked questions
What are the most important creative operations metrics?
Key metrics include project cycle time, throughput, resource utilization, project profitability, error rate, client satisfaction (NPS/CSAT), and employee turnover. Focusing on these provides a holistic view of operational health.
How can I improve my agency's project profitability?
Improve project profitability by accurately tracking project costs, understanding client profitability, managing scope creep through clear feedback and approval processes, and optimizing resource allocation to reduce non-billable hours.
What is the role of client feedback in creative operations metrics?
Client feedback directly impacts metrics like cycle time, rework percentage, and client satisfaction scores. Centralizing and managing feedback effectively reduces misunderstandings, speeds up approvals, and improves overall project quality and client perception.
How does resource allocation affect agency efficiency?
Effective resource allocation ensures that team members are utilized efficiently, work is distributed fairly, and skills are matched to project needs. Poor allocation leads to bottlenecks, burnout, decreased morale, and longer project cycle times.