Everyone thinks they know what an infographic costs. You see a few online, maybe a quick Google search, and you’ve got a number in your head. That number is probably too low. And it’s definitely missing the point.
The real cost of an infographic isn't just the design hours. It’s about the strategy, the data, the revisions, and the impact it's supposed to make. For US businesses in media, where attention is currency, a cheap infographic is a wasted opportunity.
1. The Surface-Level Sticker Price: Design & Production
Let’s start with what most people see: the design itself. This is where the immediate costs pile up.
A professional infographic requires:
- Research & Data Gathering: Finding reliable sources, sifting through data.
- Content Strategy & Narrative: Defining the story the infographic will tell.
- Information Design: Structuring complex data into a digestible visual flow.
- Graphic Design: Creating custom illustrations, icons, and layout.
- Copywriting & Editing: Ensuring clarity and conciseness.
- Revisions: Incorporating client feedback.
For a US-based agency, hourly rates can range from $75 to $250+. A simple, data-heavy infographic might take 20-40 hours. A more complex, narrative-driven one could easily hit 60-100+ hours. That’s $3,000 to $25,000+ just for the design and content creation.
Beware of super-low bids. They often mean:
- Offshore, less experienced designers.
- Template-based work, not custom.
- Limited revisions.
- Minimal research or strategic input.
You get what you pay for, especially in visual communication.
2. The Hidden Costs: Strategy & Research
This is where most businesses, especially in fast-paced media, cut corners. And it’s a critical mistake. An infographic without a solid strategy is just pretty pictures.
2.1. Defining the Objective
What do you want this infographic to *do*? Increase brand awareness? Drive traffic? Explain a complex topic? Educate your audience?
Without a clear objective, the infographic lacks direction. The design might look good, but it won't achieve anything.
2.2. Audience Analysis
Who are you trying to reach? What are their pain points? What information do they need?
Tailoring the content and design to your specific audience is paramount. A generic infographic won't resonate.
2.3. Data Sourcing & Validation
Reliable data is the backbone of a credible infographic. This means:
- Identifying authoritative sources (government reports, academic studies, industry surveys).
- Cross-referencing data for accuracy.
- Understanding the context and limitations of the data.
Spending time here prevents embarrassing errors and builds trust with your audience.
2.4. Narrative Development
An infographic isn't just a collection of facts; it's a story. What’s the arc? What’s the key takeaway?
This requires skilled content strategists and copywriters who can distill complex information into a compelling narrative. This is a high-value skill, and it costs accordingly.
3. The Iteration Tax: Revisions & Approvals
No creative project is perfect on the first try. Revisions are a natural part of the process. But uncontrolled revisions can balloon costs.
3.1. Scope Creep
Client requests can expand beyond the original brief. This is often unintentional but always impacts timelines and budgets.
Clear project scope, defined deliverables, and a structured feedback process are essential.
3.2. Feedback Loops
How is feedback collected? Is it consolidated? Is it actionable?
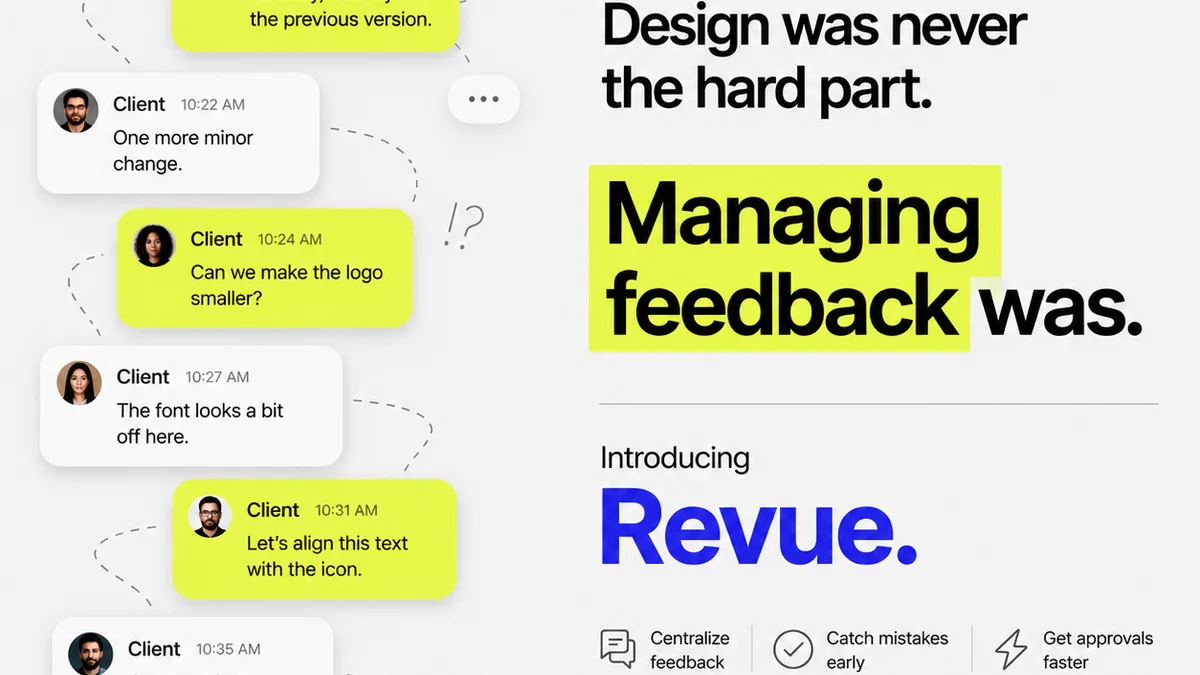
Disorganized feedback leads to wasted time trying to decipher conflicting notes or redoing work. This is where a centralized platform becomes invaluable.
3.3. Rounds of Revisions
Most quotes include a set number of revision rounds (usually 2-3). Each additional round adds to the cost.
Educate clients on the revision process and the implications of scope changes. Set expectations upfront.
4. The Long Tail: Distribution & Measurement
Creating an infographic is only half the battle. Getting it seen and understanding its impact is the other.
4.1. Distribution Strategy
Where will you share this infographic? Social media? Your blog? Email newsletters? Paid promotion?
A distribution plan ensures your investment reaches your target audience. This might involve graphic design for social snippets or ad creatives.
4.2. SEO Optimization
Infographics can be powerful SEO tools. Optimizing the accompanying blog post or landing page with relevant keywords (like “infographic cost guide”) helps with search visibility.
4.3. Performance Tracking
How do you measure success? Page views? Social shares? Leads generated? Backlinks earned?
Defining KPIs beforehand and tracking them post-launch is crucial for proving ROI and informing future content efforts.
5. The Agency Factor: Location & Expertise
Where your agency is based and their level of expertise significantly impacts cost.
5.1. US vs. Offshore
Agencies in major US cities with top-tier talent will command higher rates than offshore teams. This reflects higher operating costs, salaries, and often, a deeper understanding of the US market and media landscape.
5.2. Specialization
Agencies specializing in data visualization or specific industries (like media) may charge a premium for their niche expertise. They understand the nuances, the trends, and the audience better.
5.3. Agency Size & Overhead
Large, established agencies have higher overheads (office space, extensive teams, marketing) which are factored into their pricing. Boutique agencies or freelancers might offer lower rates but potentially with less robust processes.
Where Revue Fits In
Managing the creation and deployment of valuable assets like infographics can become complex. That’s where a tool designed for creative workflows makes a difference.
Revue helps by:
- Centralizing Feedback: All client comments and stakeholder input are in one place, reducing miscommunication and endless email chains.
- Streamlining Revisions: Visualizing changes and tracking approval status provides clarity for both your team and the client.
- Ensuring Quality Control: Standardized checklists and approval gates help maintain brand consistency and project standards before launch.
By bringing order to the chaos of creative feedback and approvals, Revue ensures your infographic project stays on track, within budget, and delivers maximum impact.
Final Thought
The cost of an infographic is a reflection of the strategic thinking, creative execution, and careful planning that goes into it. If you're looking for the cheapest option, you're likely not looking for the most effective one.
What's the true value of an infographic that perfectly captures your audience's attention and drives your business goals?
Frequently asked questions
What is the average cost of a professional infographic in the US?
The average cost for a professional infographic in the US can range widely, typically from $3,000 for a basic design to $25,000+ for a highly complex, data-driven, and strategically planned piece. This depends heavily on the scope, research required, design complexity, and the agency's expertise.
What factors influence infographic pricing the most?
The primary factors influencing infographic pricing include the depth of research and data sourcing, the complexity of the information design and custom graphics, the number of revisions included, the expertise and location of the design team (US-based vs. offshore), and the inclusion of strategy and distribution planning.
Can a cheap infographic be effective?
While technically possible, a 'cheap' infographic often sacrifices quality in key areas like research, strategic messaging, and custom design. This can lead to a less impactful, less credible, or even inaccurate final product that fails to achieve business objectives. For businesses in media, where impact is crucial, investing in quality is usually more cost-effective in the long run.
How many revisions are typically included in infographic costs?
Most professional infographic projects include 2-3 rounds of revisions. Additional rounds beyond the initial scope are usually billed separately, either at an hourly rate or as part of a revised project fee. Clear communication and a structured feedback process can help minimize the need for extra revisions.