Everyone thinks great infographics are about pretty charts and trendy icons. You’ve seen them. They look good, sure. But do they actually do anything?
None of that is wrong. But it’s incomplete.
The hard truth? For legal marketing teams, an infographic is a tool for clarity, credibility, and persuasion. It’s not just decoration. It’s a strategic asset. When done right, it simplifies complex legal concepts, builds trust with potential clients, and differentiates your firm in a crowded market. When done wrong, it’s just noise. Or worse, it’s misleading.
1. Define Your Objective: What’s the Point?
Before a single pixel is placed, ask: What do you need this infographic to achieve? Is it to:
- Explain a complex legal process (e.g., estate planning, personal injury claims)?
- Demystify new legislation or regulations?
- Highlight your firm’s unique expertise or case results?
- Drive traffic to a specific landing page or resource?
- Educate the public on a legal right or responsibility?
Your objective dictates everything else: the content, the tone, the design, and the distribution strategy. Without a clear objective, you’re designing a beautiful void.
The Audience Dictates the Depth
Who are you talking to? Potential clients? Referring attorneys? Industry peers? The language and complexity must match. A general audience needs simpler terms and more visual storytelling. A specialized audience can handle more technical detail. Don't assume your audience knows what you know. That's a common marketing mistake.
2. Content is King (Even in Visuals)
An infographic’s visual appeal is secondary to its informational value. If the data is wrong, incomplete, or irrelevant, no amount of slick design will save it.
Gathering and Verifying Data
This is paramount in legal marketing. Accuracy is non-negotiable.
- Source Credibility: Use only reputable sources. This includes internal firm data (case studies, anonymized client outcomes), government statistics, peer-reviewed legal journals, and official regulatory bodies.
- Fact-Checking: Every statistic, claim, and legal assertion must be verified by a qualified attorney on your team. Double-check dates, figures, and legal interpretations.
- Attribution: Clearly cite all sources. This builds trust and avoids accusations of misrepresentation. Add a small, legible attribution line at the bottom.
Structuring the Narrative
Even data needs a story. How does the information flow logically?
- Start with the Problem/Question: What issue are you addressing?
- Present Key Data Points: Use clear, concise language.
- Explain the Implications: What does this data mean for the reader?
- Offer Solutions/Next Steps: What should the reader do with this information? (This is where you subtly guide them toward your firm.)
Avoid jargon. Legal language is precise but often impenetrable to outsiders. Translate legalese into plain English. Think about the content strategy for the legal sector.
3. Design for Clarity, Not Clutter
Once the content is solid, the design brings it to life. But clarity is the primary goal.
Visual Hierarchy
Guide the reader’s eye. The most important information should be the most prominent.
- Headlines and Subheadings: Use clear, descriptive titles.
- Font Size and Weight: Vary these to distinguish levels of information.
- Color Contrast: Ensure readability. Use contrast checkers to meet accessibility standards.
- Whitespace: Don't cram information. Give elements room to breathe.
Choosing the Right Visuals
Icons, charts, and illustrations should support the content, not distract from it.
- Consistency: Maintain a consistent style throughout.
- Relevance: Does the visual accurately represent the data or concept? A bar chart for comparison, a line graph for trends, an icon for a concept.
- Simplicity: Avoid overly complex or 3D graphics that can obscure data.
- Accessibility: Ensure charts are easy to read. Avoid color combinations that are difficult for colorblind individuals.
Consider the principles of visual design, like those outlined in the Material Design guidelines for data visualization, even if you aren't using Material Design directly. The principles of clarity and hierarchy apply universally.
4. Legal and Compliance Review
This step is often overlooked by marketing teams, but it’s critical for legal firms.
Accuracy Check
A senior attorney must review the infographic for legal accuracy. This includes:
- Correct interpretation of statutes and case law.
- Up-to-date information.
- Absence of misleading statements or guarantees.
- Proper disclaimers.
Compliance Considerations
Depending on your jurisdiction and practice area, there may be specific rules about attorney advertising. Ensure your infographic complies with:
- Bar association rules.
- State-specific advertising regulations.
- Ethics opinions.
A failure here can lead to disciplinary action, not just a bad marketing campaign.
5. Distribution and Promotion
Creating a great infographic is only half the battle. Getting it seen is the other.
Platform Optimization
Tailor your distribution to where your audience lives.
- Website: Embed it on relevant service pages, blog posts, and resource sections. Make it easily shareable.
- Social Media: Break it down into smaller shareable chunks or use snippets. Platforms like LinkedIn are ideal for B2B legal marketing.
- Email Marketing: Include it in newsletters to clients and prospects.
- Paid Promotion: Consider targeted ads on social media or search engines.
- Outreach: Pitch it to relevant legal publications or industry blogs.
SEO Integration
Optimize the page where the infographic is hosted.
- Descriptive Title and Alt Text: For the image file and the embed.
- Relevant Keywords: Use keywords naturally in the surrounding text.
- Internal Linking: Link to it from other relevant pages on your site.
- External Linking: If appropriate, link out to authoritative sources (like government sites or bar associations).
Think about how users might search for this information. Long-tail keywords like “infographic understanding personal injury claims” could be valuable.
Where Revue Fits In
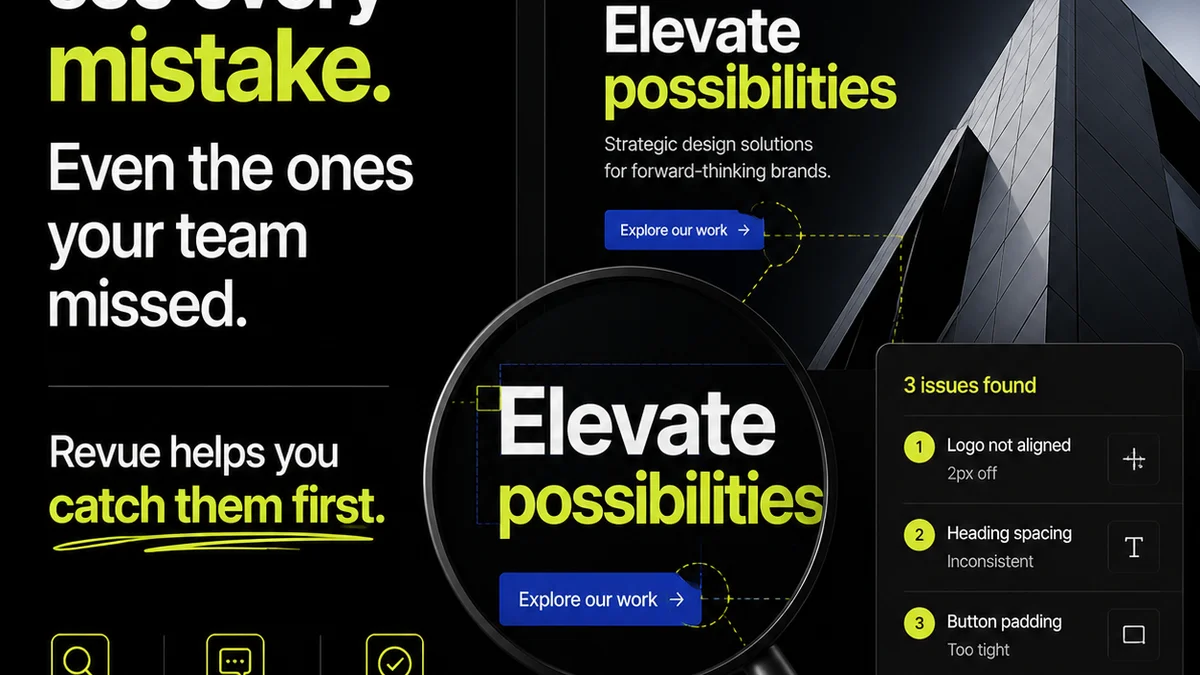
Managing the creation and approval of legal marketing collateral like infographics can be complex. Multiple stakeholders—marketing, attorneys, compliance—need to weigh in. Revisions can get lost. Feedback can be scattered across emails, chats, and meetings.
Revue offers a centralized platform for creative workflows. You can upload drafts, gather consolidated feedback directly on the visual, track revision history, and manage approvals with clear visibility.
- Streamlined Feedback: All comments pinned directly to the infographic, reducing back-and-forth.
- Version Control: See every iteration and who approved what.
- Clear Approval Flows: Ensure legal and compliance sign-off happens before publication.
- Centralized Asset Management: Keep all your finalized infographics organized and accessible.
This ensures your marketing team and legal reviewers are always on the same page, reducing errors and speeding up time-to-market for crucial content.
Final Thought
An infographic in legal marketing isn't just a visual. It's a bridge. A bridge between complex legal concepts and a client's understanding. A bridge between a firm's expertise and a potential client's need. A bridge built on accuracy, clarity, and trust. Are your infographics building those bridges, or just adding decoration?
Frequently asked questions
What are the key elements of a legal infographic?
A legal infographic must prioritize accuracy and clarity. Key elements include a defined objective, verifiable data from credible sources, plain English explanations, clear visual hierarchy, consistent design, and rigorous legal/compliance review. Attribution and disclaimers are also crucial.
How can I ensure legal accuracy in my infographics?
Ensure accuracy by using only reputable sources, having every statistic and legal assertion fact-checked by a qualified attorney, and obtaining formal sign-off from a senior lawyer. Always include clear source attribution and necessary disclaimers.
What are common mistakes legal marketing teams make with infographics?
Common mistakes include focusing too much on design over content accuracy, using jargon without explanation, failing to get thorough legal and compliance review, not defining a clear objective, and neglecting proper distribution and SEO optimization.
How do infographics help build trust in the legal sector?
Infographics build trust by simplifying complex topics, demonstrating expertise through clear data presentation, showing transparency with source attribution, and ensuring accuracy through rigorous review. This clarity and credibility reassure potential clients.