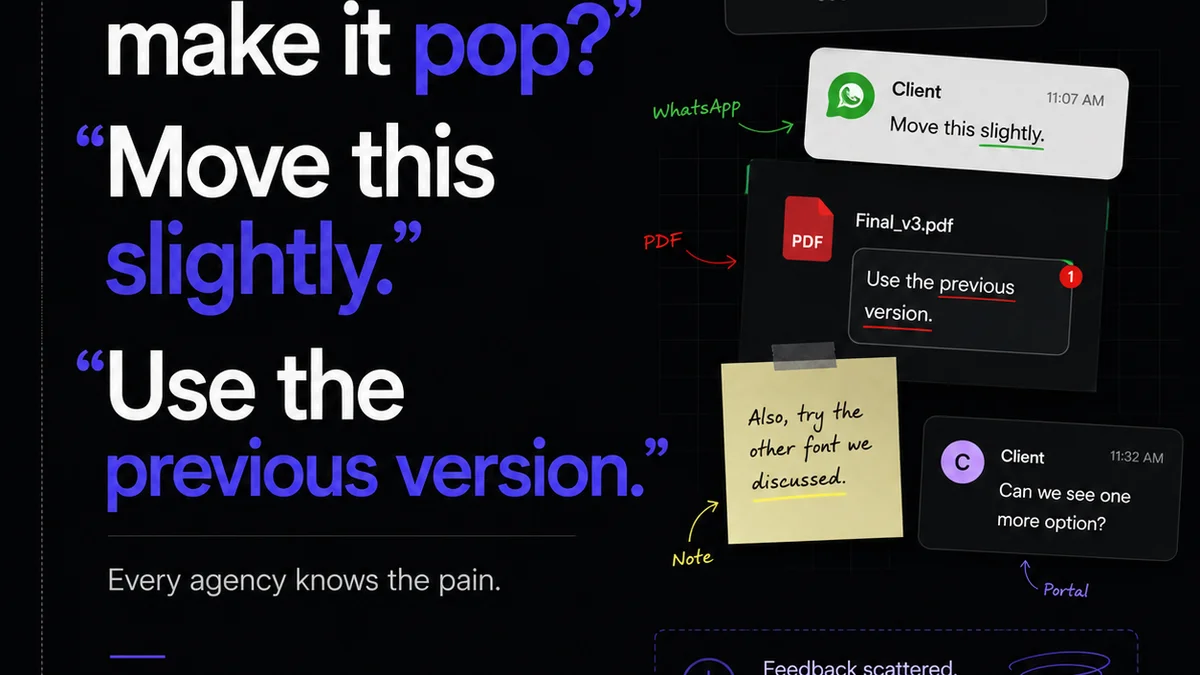
Legal infographics. The words themselves might conjure images of dense legalese translated into a few colorful icons. It sounds simple, right? Just slap some visuals on a contract summary and call it a day.
None of that is wrong. But it’s incomplete.
The hard truth is that most legal infographics fail to live up to their potential because they treat visual communication as an afterthought, a decorative layer rather than a strategic tool. In reality, a well-crafted infographic can be a game-changer for clarity, client retention, and even case outcomes. It’s about distilling complex legal concepts into digestible, memorable visuals.
1. Why Legal Infographics Aren't Just for Marketing
Many assume infographics are purely for marketing teams trying to make dry topics “engaging.” For law firms, this couldn't be further from the truth. While marketing is a valid use case, the real power of infographics in the legal sector lies in their ability to:
- Simplify complex case details for clients.
- Explain intricate legal processes (like discovery or appeals).
- Summarize settlement terms or verdicts clearly.
- Visualize data for expert testimony or litigation.
- Enhance compliance training and policy understanding.
- Demystify legal jargon for the public or potential clients.
Think about a client facing a complex personal injury claim. Pages of medical jargon and legal procedures can be overwhelming. An infographic can break down the timeline of their case, the parties involved, and the potential outcomes in a way that fosters understanding and trust.
This isn't about dumbing down the law. It's about effective communication.
The Client Experience Revolution
Clients come to lawyers for expertise, but they often leave feeling confused. This communication gap breeds anxiety and distrust. Infographics bridge that gap.
When a client can *see* the stages of their case, understand the implications of a specific clause, or grasp the scope of a settlement without wading through dense text, their confidence in your firm grows.
Internal Efficiency and Clarity
It’s not just external. Infographics can streamline internal processes too. Imagine onboarding new paralegals: a visual flowchart of your firm's standard operating procedures is far more effective than a lengthy manual.
Or consider explaining a new regulatory change to your entire team. An infographic highlighting key changes and compliance requirements ensures everyone gets the message quickly and accurately.
2. The Anatomy of an Effective Legal Infographic
Creating a legal infographic isn't just about picking nice fonts and colors. It requires a strategic approach, blending legal accuracy with design principles. Here’s what works:
Define Your Objective
Before you even think about visuals, ask: What is this infographic supposed to achieve? Who is the audience? What is the single most important message you want them to take away?
An infographic explaining a class-action settlement to potential claimants will look very different from one detailing the elements of a specific tort for a legal journal.
Know Your Audience
Are you explaining something to a layperson client, fellow legal professionals, judges, or a jury? Tailor the complexity, tone, and visual style accordingly.
- For Clients: Focus on clarity, empathy, and actionable information. Avoid jargon.
- For Professionals: You can use more technical terms, but clarity and conciseness are still paramount. Focus on data and analysis.
- For Juries: Visual storytelling is key. Simplify complex points, use relatable analogies, and ensure emotional resonance where appropriate.
Content is King (Even in Visuals)
Accuracy is non-negotiable in law. Every statistic, every claim, every process described must be legally sound and verifiable. Work closely with your legal experts to ensure the information is precise.
Then, find the story within the data. What narrative does the information tell? An infographic should guide the viewer through this narrative.
Visual Strategy: Less is More
This is where many legal infographics falter. They become cluttered.
- Color Palette: Stick to a professional, limited color palette. Blues, grays, and subtle accent colors often work best. Avoid overly bright or distracting combinations.
- Typography: Choose legible fonts. Use font weights and sizes to create hierarchy, not just for decoration.
- Iconography: Use icons consistently. Ensure they are universally understood or clearly labeled. Avoid overly complex or abstract icons.
- Data Visualization: Charts and graphs should be simple and clearly labeled. Bar charts, line graphs, and pie charts are often sufficient. Avoid 3D charts or overly complex visualizations that obscure data.
- Layout: Create a clear visual flow from top to bottom or left to right. Use white space effectively to prevent the design from feeling cramped.
The goal is to enhance understanding, not to overwhelm.
3. Practical Applications: Infographics in Action
Let’s move beyond theory. Where can you realistically deploy infographics in a legal context?
Litigation Support
Visualizing timelines of events, complex financial data, or the relationships between parties can be incredibly persuasive in court or in settlement negotiations.
Imagine presenting a jury with an infographic that clearly illustrates the sequence of events leading to an accident, or a chart showing the financial damages. It’s far more impactful than reading dates and figures aloud.
Client Onboarding and Education
When a new client signs on, provide them with an infographic that outlines:
- The typical stages of their case.
- Key milestones and what to expect.
- Contact information for relevant team members.
- A glossary of common legal terms they might encounter.
This proactive approach sets expectations and reduces client anxiety from day one.
Compliance and Training
Regulatory changes, internal policies, or ethical guidelines can be dense. An infographic can:
- Highlight the most critical changes.
- Explain new procedures step-by-step.
- Summarize key obligations and responsibilities.
This makes compliance more accessible and memorable for all employees.
Settlement and Verdict Summaries
For complex settlements or jury verdicts, an infographic can provide a clear, concise overview for clients, media, or interested parties. It distills the key outcomes and financial details without requiring a deep dive into the legal documents.
Public Outreach and Thought Leadership
Law firms can use infographics to explain common legal issues (e.g.,
Frequently asked questions
What is the primary benefit of using infographics in the legal field?
The primary benefit is simplifying complex legal information, making it more understandable for clients, juries, and the public. This enhances clarity, improves communication, and can build trust.
Are legal infographics only for marketing?
No. While they can be used for marketing, their most powerful applications are in litigation support, client education, internal training, compliance, and summarizing case outcomes.
What are the key elements of a good legal infographic?
Key elements include a clear objective, audience understanding, legally accurate content, a professional and limited color palette, legible typography, consistent iconography, simple data visualization, and a clean layout with ample white space.
How can infographics help with client communication?
Infographics can clearly outline case timelines, explain legal processes, define terms, and summarize settlement details, reducing client anxiety and improving their understanding of their legal situation.
Can infographics be used in court proceedings?
Yes. Infographics can be powerful tools in litigation to visually present complex data, timelines, or relationships between parties to judges and juries, making abstract concepts more concrete and persuasive.