Everyone talks about the importance of product design. They say it drives user engagement, boosts conversion rates, and builds brand loyalty. None of that is wrong. But it’s incomplete.
The deeper truth? Great product design isn't just about making things look good or feel intuitive. It's a direct driver of business outcomes. And if you can't measure that, you're leaving money on the table.
Understanding and articulating your Product Design ROI is crucial. It’s how you justify budgets, secure buy-in, and prove your team’s value. It’s the difference between being seen as a cost center and a revenue generator.
1. The Misconception: Design is Purely Aesthetic or Functional
The most common mistake is viewing design as a separate, often subjective, layer applied *after* the product is conceived. Or worse, as just a series of functional improvements. This thinking misses the forest for the trees.
Great design is strategic. It starts at the problem definition stage and influences every decision, from feature prioritization to market positioning. It’s about solving business problems through user experience.
The Hard Truth: Design is a Business Strategy Tool
When design is integrated deeply into the product development lifecycle, it directly impacts key business metrics. It’s not an add-on; it’s a core component of product success.
This means moving beyond vanity metrics like pretty interfaces. We need to connect design decisions to tangible business results. This is where ROI comes in.
2. Defining Product Design ROI
Product Design ROI (Return on Investment) is the measure of the financial benefits derived from investing in product design activities, compared to the costs of those activities.
It’s about quantifying the value. How much did we gain, financially, because of the design work we did?
The Formula (Simplified)
ROI = (Gain from Investment - Cost of Investment) / Cost of Investment
In product design, this translates to:
Product Design ROI = (Monetary Value of Design Impact - Cost of Design Efforts) / Cost of Design Efforts
The challenge, of course, lies in accurately measuring both sides of that equation.
3. Quantifying the Cost of Design Efforts
This is the easier part. Costs typically include:
- Salaries and benefits for designers, researchers, and UX writers.
- Software licenses (design tools, prototyping software, research platforms).
- User research expenses (participant recruitment, incentives, testing platforms).
- External agency or consultant fees.
- Training and professional development.
Be thorough here. Include all direct and indirect costs associated with your design team and processes.
4. Measuring the Gain from Design Investment
This is where it gets tricky. The 'Gain' is the monetary value generated by the design improvements. This value can manifest in several ways:
4.1 Increased Revenue
This is the most direct link. How does design drive more money?
- Higher Conversion Rates: A clearer checkout process, more persuasive calls-to-action, or an easier onboarding flow can directly increase the number of users who complete a desired action (purchase, sign-up, etc.).
- Increased Average Order Value (AOV): Improved product recommendations, better cross-selling, or a more satisfying shopping experience can encourage users to spend more per transaction.
- New Revenue Streams: Design can uncover opportunities for new features or services that users are willing to pay for.
4.2 Reduced Costs
Design can also save money, which increases profitability. This is often overlooked but is a significant part of ROI.
- Lower Support Costs: Intuitive design and clear information architecture reduce user confusion, leading to fewer support tickets and calls. If a user doesn't need to ask for help, that’s a cost saving.
- Reduced Development Rework: Thorough user research and prototyping upfront catch usability issues before expensive code is written. Fixing a design flaw in Figma is far cheaper than fixing it in production.
- Faster Time-to-Market: Streamlined design processes and clear handoffs can accelerate development cycles, allowing you to capture market share sooner.
4.3 Improved User Engagement and Retention
While harder to tie directly to immediate revenue, these metrics are critical leading indicators of long-term financial health.
- Increased User Stickiness: A delightful and efficient user experience keeps users coming back.
- Higher Retention Rates: Users are less likely to churn if they find value and ease in your product.
- Increased Lifetime Value (LTV): Retained users who engage deeply with your product over time represent significant long-term revenue.
4.4 Enhanced Brand Value and Loyalty
This is more intangible but has real business impact.
- Stronger Brand Perception: A consistently well-designed product builds trust and positions the brand as a leader.
- Positive Word-of-Mouth: Delighted users become advocates, driving organic growth.
- Competitive Advantage: Superior design can be a key differentiator in crowded markets.
5. Methodologies for Measurement
So, how do you actually measure these 'Gains'? It requires a combination of quantitative and qualitative methods.
5.1 A/B Testing
The gold standard for measuring the impact of specific design changes on conversion rates. Test variations of a button color, a form layout, or a headline to see which performs better.
Tools like Google Optimize (though sunsetting, principles apply), Optimizely, or VWO are essential here.
5.2 User Analytics
Track user behavior within your product. Key metrics include:
- Conversion rates (overall and for specific funnels).
- Task completion rates.
- Time on task.
- Feature adoption rates.
- Drop-off points in user flows.
- User retention cohorts.
Platforms like Google Analytics, Mixpanel, or Amplitude are invaluable.
5.3 Usability Testing & Research
While often qualitative, usability testing can reveal critical pain points that, when fixed, lead to measurable improvements. Record sessions, observe user struggles, and ask targeted questions.
Post-test surveys can also capture user satisfaction (e.g., using the System Usability Scale - SUS).
5.4 Customer Feedback & Surveys
Directly ask your users about their experience. Net Promoter Score (NPS), Customer Satisfaction (CSAT), and targeted surveys about specific features can provide insights.
Correlate feedback with behavioral data to understand the 'why' behind the numbers.
5.5 Support Ticket Analysis
Categorize and track the volume and nature of support requests. A reduction in tickets related to usability issues is a direct cost saving attributable to design improvements.
6. Connecting Design Efforts to Business Outcomes
This is the crucial step: linking specific design initiatives to the measured gains. This requires clear goal setting and tracking.
6.1 Set Clear Objectives (Before You Start)
Every design project should have measurable goals tied to business outcomes. Instead of 'redesign the checkout', aim for 'reduce checkout abandonment by 15% by simplifying the form fields and clarifying shipping costs'.
6.2 Establish Baselines
Before implementing any design change, measure the current performance of the key metrics you aim to impact. This is your baseline.
6.3 Track and Attribute
After the redesign, continue tracking those metrics. Use A/B testing to isolate the impact of your changes. Analyze user analytics and feedback to understand adoption and satisfaction.
Attribute the measured improvement (e.g., the 15% reduction in abandonment) to the design changes. Calculate the monetary value of that improvement (e.g., 15% fewer lost sales * average order value).
6.4 Calculate the ROI
Now, plug your numbers into the ROI formula:
ROI = (Monetary Value of Reduced Abandonment - Cost of Redesign Project) / Cost of Redesign Project
6.5 Example Scenario
Let's say a redesign of a key user flow cost $50,000 in design and development time. This redesign led to a 10% increase in feature adoption, which you estimate generates an additional $200,000 in annual revenue.
- Gain from Investment: $200,000
- Cost of Investment: $50,000
- ROI = ($200,000 - $50,000) / $50,000 = $150,000 / $50,000 = 3
This translates to a 300% ROI. That’s a powerful number.
7. Where Revue Fits In
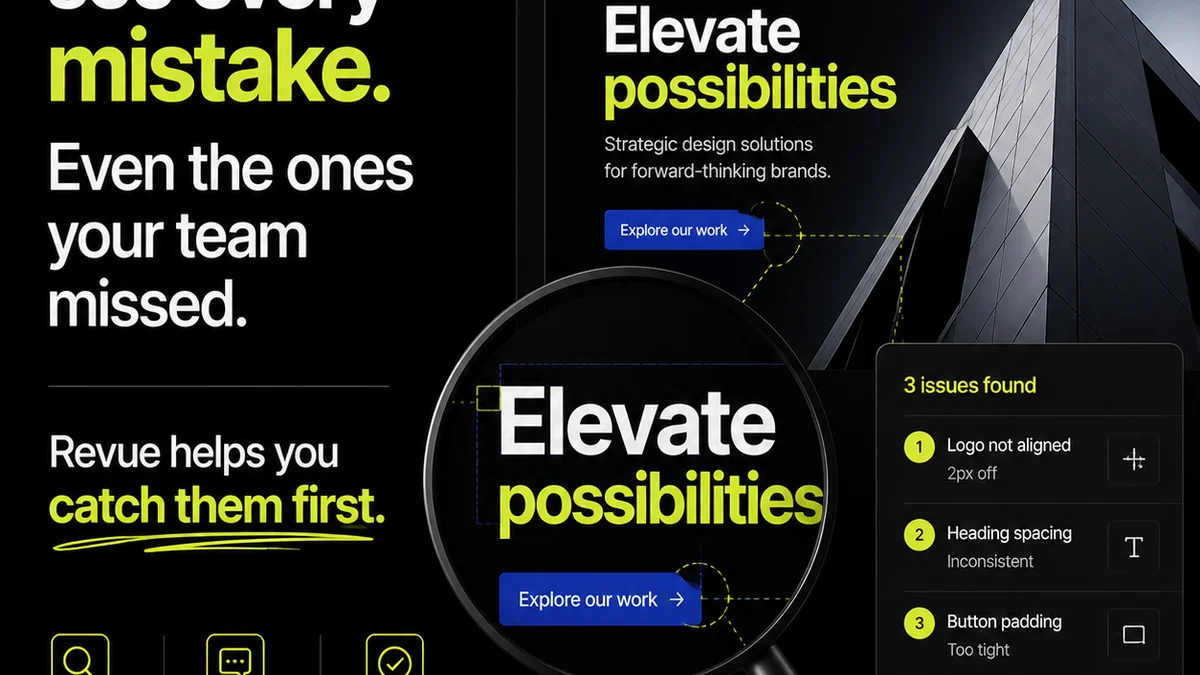
Managing the feedback, revision, and approval process is critical for both accurately tracking design efforts and ensuring the quality that drives ROI. Inefficiencies here obscure both costs and gains.
Centralized Feedback: When client feedback is scattered across emails, Slack messages, and random documents, it's impossible to track what was requested, what was implemented, and who approved what. Revue provides a single source of truth, making it easier to attribute design changes to specific stakeholder input and track the evolution of requirements.
Revision and Approval Visibility: Understanding the scope and impact of revisions is key. Revue’s structured workflow allows teams to see exactly which versions were approved, which changes were made between versions, and the associated timelines. This clarity helps quantify the effort spent on revisions and ensures that approved changes align with business goals.
Quality Assurance Checks: Before a design is finalized or handed off, quality checks are essential. Revue helps ensure that all feedback has been addressed, all requirements met, and that the final output aligns with the initial objectives. Catching issues early, before development, significantly reduces costly rework – a direct boost to your ROI.
By streamlining these core aspects of the creative workflow, Revue helps ensure that design efforts are focused, efficient, and demonstrably linked to positive business outcomes.
8. Common Pitfalls to Avoid
Calculating ROI isn't foolproof. Beware of these common traps:
- Attributing too much: Don't credit design for *all* revenue increases. Marketing, sales, and product strategy all play roles. Isolate the design impact as much as possible.
- Ignoring qualitative benefits: While ROI focuses on financials, don't dismiss the value of improved user satisfaction, team morale, or brand reputation. These often *lead* to financial gains.
- Not tracking consistently: ROI isn't a one-time calculation. It requires ongoing monitoring and analysis to demonstrate sustained value.
- Focusing only on new features: Improving existing workflows and fixing usability issues on core features often yields a higher ROI than building something entirely new.
- Lack of clear ownership: Who is responsible for tracking and reporting on design ROI? Ensure accountability.
9. Final Thought
Product design is no longer a 'nice-to-have.' It's a fundamental driver of business success. By moving beyond subjective opinions and embracing data-driven measurement, you can finally prove the tangible value your design team brings to the table.
Are you ready to stop hoping your design work is valuable and start *knowing* it?
Frequently asked questions
What is the basic formula for ROI in product design?
The basic formula for ROI is (Gain from Investment - Cost of Investment) / Cost of Investment. For product design, this means measuring the monetary value generated by design improvements against the cost of the design efforts.
How can design directly increase revenue?
Design can increase revenue by improving conversion rates (e.g., easier checkout), increasing average order value (e.g., better recommendations), and enabling new revenue streams through innovative features.
Besides revenue, what other financial benefits does good design provide?
Good design can reduce costs by lowering support ticket volume due to better usability, decreasing development rework by catching issues early, and potentially speeding up time-to-market.
What are the key metrics to track for Product Design ROI?
Key metrics include conversion rates, user retention, customer lifetime value (LTV), support costs, task completion rates, and feature adoption rates. A/B testing and user analytics are crucial for tracking these.
Is it possible to measure the ROI of intangible design benefits like brand loyalty?
While harder to quantify directly, intangible benefits like brand loyalty and positive word-of-mouth often lead to measurable financial outcomes such as increased customer lifetime value and reduced customer acquisition costs over time. Tracking metrics like NPS and correlating them with long-term revenue trends can help demonstrate this link.