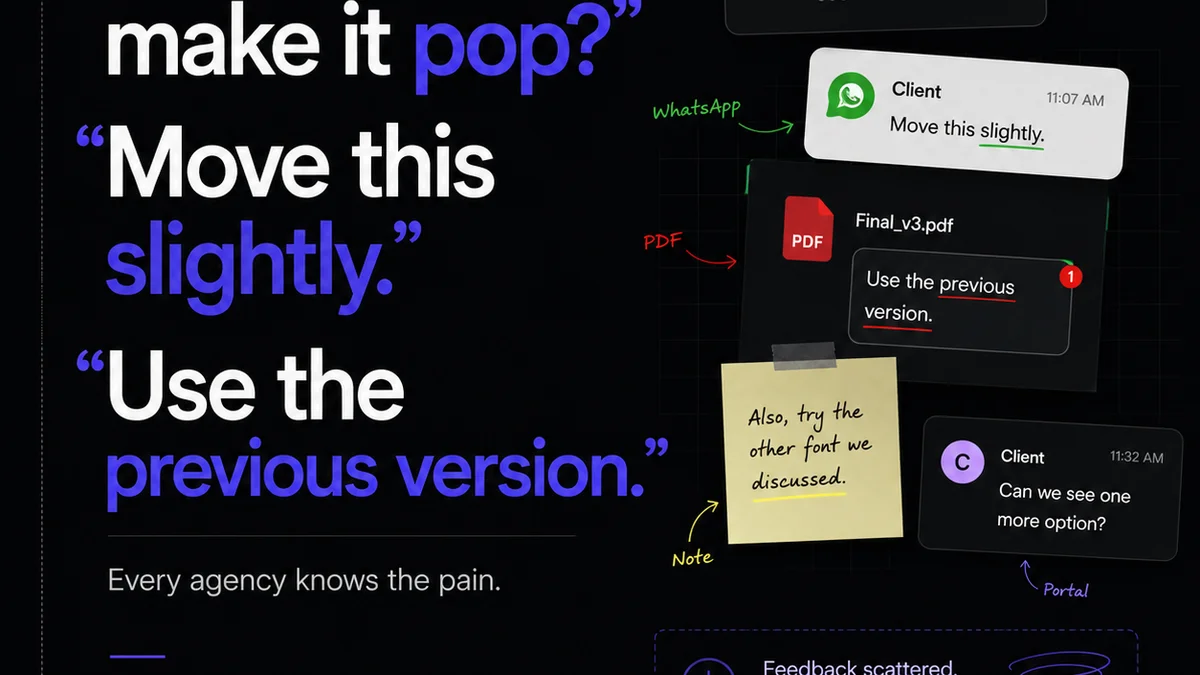
Everyone talks about creative metrics. Client satisfaction scores. On-time delivery rates. Project profitability. None of that is wrong. But it’s incomplete.
The real truth? Most agencies are measuring the wrong things. Or at least, they're measuring them in the wrong way. They focus on surface-level outputs, not the underlying drivers of quality, efficiency, and client loyalty.
This isn't about vanity metrics or chasing arbitrary numbers. It's about understanding the operational gears that make your creative engine run smoothly and profitably. It's about making data-informed decisions that actually impact your bottom line and your team's sanity.
Let's move beyond the obvious and into what truly matters.
1. Rethinking 'On-Time Delivery'
The standard metric is simple: Was the deliverable submitted by the deadline? Yes or no. That’s it.
But this binary approach misses the nuance. Was it on time but riddled with errors? Did it require three last-minute sprints to hit the date? Was the client happy with the final product, even if it technically landed on time?
A more advanced view looks at quality-adjusted delivery time.
The Hidden Costs of 'On-Time'
- Scope creep that inflates effort without changing the deadline.
- Excessive revisions due to unclear initial briefs or feedback loops.
- Team burnout from rushed work to meet arbitrary dates.
- Client dissatisfaction disguised by a timely delivery.
- Wasted hours on rework that should have been caught earlier.
This isn't about blaming teams for missing deadlines. It's about identifying the systemic issues that *cause* deadlines to be missed or met at the expense of quality.
Measuring What Matters: The Real Metrics
- Revision Cycles per Project: Track the number of significant revision rounds. A high number points to briefing issues or client miscommunication.
- Time Spent on Rework vs. Original Work: Is 30% of your time spent fixing things that should have been right the first time?
- Client Feedback Clarity Score: This is harder to quantify, but you can develop a simple internal rating system. Was feedback specific, actionable, and concise, or vague and contradictory?
- Internal Quality Assurance Pass Rate: How often does a project pass internal QA on the first attempt?
By looking at these, you start to see *why* projects are late or stressful, not just *if* they are.
2. Profitability: It's Not Just About Billable Hours
Agencies often equate profitability with billable hours. If you’re billing 80% of available hours, you’re doing great, right?
Wrong.
This assumes all billable hours are created equal. They are not.
An hour spent in a chaotic, inefficient revision cycle is far less profitable than an hour spent on focused, high-value creative work. Profitability isn't just about filling the timesheet; it's about the *value* generated per hour.
The Profitability Drain
- Unbilled time spent chasing down feedback.
- Hours lost to administrative tasks that could be automated.
- Internal meetings that meander without clear objectives.
- Projects that run over budget due to poor planning or scope creep.
- Client service hours that aren't directly tied to project value.
You can be 100% billable and still lose money on a project.
Deep Dive Metrics for True Profitability
- Profit Margin per Client/Project: This is the gold standard. Understand the actual profit generated after all costs (direct labor, overhead, software, etc.) are accounted for.
- Revenue per Employee: A classic, but still vital. Are your teams generating enough revenue to cover their costs and contribute to profit?
- Cost of Poor Quality (COPQ): This includes the cost of internal/external failures. Rework, wasted materials, client complaints, lost business.
- Efficiency Rate: Compare actual time spent to estimated time. Significant variances indicate estimation problems or workflow inefficiencies.
- Utilization Rate vs. Realization Rate: Utilization is the percentage of time employees are working on billable projects. Realization is the percentage of billed hours that are actually collected from the client. You can have high utilization but low realization if you're not invoicing correctly or clients aren't paying.
Focusing on these numbers tells you where the money is truly being made or lost, not just where the hours are being logged.
3. Client Satisfaction: Beyond the Post-Mortem Survey
The typical client satisfaction survey is sent weeks after a project ends. It’s a rearview mirror glance.
By then, any lingering frustrations have likely faded, or the client has moved on. You get polite feedback, maybe a few constructive points, but rarely the raw, actionable truth about the *process*.
True client satisfaction is built throughout the project lifecycle, not just at the end.
The Illusion of End-of-Project Feedback
- Clients may not want to burn bridges by being overly critical.
- Memory fades; specific pain points get glossed over.
- The feedback might not reflect the day-to-day experience.
- It’s often too late to course-correct based on this feedback.
You need to be measuring satisfaction *during* the engagement.
Real-Time Satisfaction Indicators
- Net Promoter Score (NPS) - Mid-Project: Send a quick NPS survey halfway through a major project. Ask: “How likely are you to recommend us based on your experience *so far*?”
- Frequency and Quality of Client Check-ins: Are you proactively communicating? Are clients responding positively to these touchpoints?
- Ease of Feedback Submission: How simple is it for clients to provide feedback? A clunky process breeds frustration before the creative even gets reviewed.
- Response Time to Client Inquiries: A quick response, even if it’s just to acknowledge receipt, builds confidence.
- Internal Team Sentiment: Happy teams often lead to happy clients. Are your creatives stressed and complaining about client interactions? That’s a red flag.
This continuous feedback loop allows you to identify and address issues *before* they become major problems, leading to a genuinely satisfied client.
4. Team Performance and Well-being: The Unsung Heroes
Creative teams are often measured by output: how many projects they can churn out. This leads to burnout and a decline in quality.
The best agencies understand that their team's well-being is directly tied to their performance and the agency's long-term success.
The Dangers of Output-Only Metrics
- Encourages quantity over quality.
- Leads to exhaustion and high turnover.
- Stifles creativity and innovation.
- Creates a culture of fear around mistakes.
- Neglects the importance of collaboration and skill development.
Your team is your greatest asset. Treat them like one.
Measuring What Fuels Your Team
- Team Utilization vs. Burnout Indicators: High utilization is good, but track overtime hours, sick days taken, and employee feedback surveys for signs of burnout.
- Skill Development Investment: Are you providing opportunities for training and growth? Track hours spent on professional development.
- Internal Collaboration Effectiveness: Use project retrospectives or simple surveys to gauge how well teams are working together.
- Employee Satisfaction Scores: Regularly survey your team about their workload, management, and overall job satisfaction.
- Retention Rate: High turnover is incredibly costly. A good retention rate is a strong indicator of a healthy work environment.
When your team is healthy, engaged, and growing, they produce better work, more efficiently, and stick around longer. It’s a virtuous cycle.
Where Revue Fits In
Managing creative workflows generates a mountain of data. Most of it is scattered across emails, chat threads, and spreadsheets.
This is where a centralized platform like Revue becomes essential for advanced metrics.
Instead of guessing, you can see.
- Centralized Feedback: All client comments are in one place, linked to specific versions. This drastically reduces time spent searching for feedback and improves the clarity score of feedback itself. You can track how many comments are received per project and how quickly they are actioned.
- Revision & Approval Visibility: See exactly how many revision rounds are happening on a project. Track the time between feedback submission and approval. This directly feeds into your 'Revision Cycles' and 'Time Spent on Rework' metrics. You can identify bottlenecks instantly.
- Quality Assurance Workflow: Integrate QA steps directly into your process. Track the pass/fail rate of internal reviews. This gives you a real-time 'Internal Quality Assurance Pass Rate' metric, highlighting potential issues before they reach the client.
- Project Timelines & Milestones: Monitor progress against deadlines with clear visibility. While Revue doesn't magically make projects on-time, it highlights where delays are occurring and why, allowing for proactive management rather than reactive scrambling.
Revue turns qualitative workflow chaos into quantifiable operational insights. It provides the data backbone for the advanced metrics we've discussed.
Final Thought
Are you managing your creative agency based on gut feeling and easily obtainable numbers, or are you digging into the operational metrics that reveal the true drivers of success? The difference isn't just about better reporting; it’s about building a more resilient, profitable, and sustainable creative business.
Frequently asked questions
What are the most common mistakes agencies make with creative metrics?
Agencies often focus on easily measurable but less impactful metrics like raw 'on-time delivery' or total billable hours. They miss the nuances of quality-adjusted delivery, the true cost of rework, and real-time client/team satisfaction, which are far more indicative of overall success and health.
How can I measure client satisfaction effectively during a project?
Instead of relying solely on end-of-project surveys, implement mid-project check-ins, track the ease and clarity of client feedback submission, monitor your response times to client inquiries, and observe the overall sentiment of client interactions throughout the engagement.
What's the link between team well-being and creative metrics?
Team well-being is crucial. Burnout leads to decreased quality, lower efficiency, and high turnover, all of which negatively impact profitability and client satisfaction. Measuring factors like overtime, sick days, and employee satisfaction provides insight into potential burnout before it affects output.
How does a platform like Revue help with advanced creative metrics?
Revue centralizes feedback, streamlines revision and approval processes, and provides visibility into project timelines and quality checks. This data can be directly used to track metrics like revision cycles, time spent on rework, internal QA pass rates, and overall project efficiency, moving beyond guesswork.