Everyone talks about agency KPIs. You’ve probably seen endless lists of metrics: client satisfaction scores, project completion rates, revenue growth. None of that is wrong. But it’s incomplete.
The real hard truth is that most agencies focus on the *outputs* of their work, not the *inputs* that drive success. They measure what happened, not *why* it happened. That’s a recipe for reactive management, not proactive growth.
True agency leadership demands a focus on operational KPIs. These are the numbers that tell you how efficiently you’re running, how effectively your teams are performing, and where the friction points are in your processes. Get these right, and the rest—profitability, client retention, growth—will follow.
1. Profitability Per Project
This is the bedrock. If you’re not profitable on a project basis, nothing else matters.
Understanding Your True Costs
It’s not just about billable hours. You need to account for:
- Internal overhead (rent, software, admin staff)
- Non-billable client time (scope creep, excessive meetings)
- Wasted time (handoffs, rework, inefficient processes)
- Cost of goods sold (if applicable, e.g., printing, media spend)
Many agencies struggle here because they don’t have clear tracking. They estimate, they guess. That’s a dangerous game.
Tracking and Analysis
Every project needs a clear budget and a way to track actual costs against it. Look at:
- Gross Profit Margin: (Revenue - Direct Project Costs) / Revenue. Aim for a healthy margin here.
- Net Profit Margin: (Revenue - All Costs) / Revenue. This is the ultimate measure of profitability.
- Realized Rate: Total Project Revenue / Total Billable Hours. How much are you *actually* earning per hour?
If a project is consistently underperforming, dig deep. Was it scope creep? Inaccurate estimating? Poor team performance? Resource bottlenecks?
2. Team Utilization & Efficiency
Your team is your biggest asset. Are they working smart, or just working hard?
Utilization Rate
This is the percentage of a team member’s available working hours that are spent on billable client work. It's a common metric, but often misunderstood.
- The Trap: Chasing 100% utilization. This is a fast track to burnout and low-quality work. Highly utilized teams have no time for strategic thinking, professional development, or internal improvements.
- The Reality: A healthy utilization rate is typically between 70-85%. This allows for billable work, but also for training, internal meetings, sales, and creative thinking.
Efficiency Metrics
Beyond just *if* they’re working, are they working *well*?
- Task Completion Time: How long does a specific task typically take vs. estimates? Are there consistent delays?
- Rework Rate: How often does work need to be redone due to errors or misinterpretations? High rework is a huge profit killer.
- Handoff Efficiency: How smooth are the transitions between departments or team members? Bottlenecks here cost time and money.
These metrics highlight process issues, training needs, or even team structure problems.
3. Project Delivery Performance
Clients care about deadlines and budget. Can you consistently deliver?
On-Time Delivery Rate
Simple, but critical. What percentage of projects are delivered by the agreed-upon deadline?
- The Cause: Missed deadlines are rarely about one thing. They're usually a symptom of deeper issues: poor planning, scope creep, resource conflicts, or unexpected roadblocks.
- The Fix: Better project management, clear scope agreements, and proactive risk assessment.
Budget Adherence
Are projects staying within the quoted budget? Consistent overages erode client trust and profitability.
- The Culprit: Often, it’s poor initial scoping or failure to manage scope creep effectively.
- The Solution: Robust change order processes and clear communication with clients about budget implications.
Client Feedback Loops
This isn't just about satisfaction surveys. It's about integrating feedback into your workflow to improve future delivery.
- Qualitative Feedback: What are clients *actually* saying during reviews? Are there recurring themes?
- Quantitative Feedback: NPS scores or simple rating systems can provide a quick pulse check.
Use this data to refine your processes, not just to pat yourselves on the back.
4. Client Retention & Lifetime Value
Acquiring new clients is expensive. Keeping existing ones is where sustainable growth lies.
Client Retention Rate
The percentage of clients you retain year over year. A high retention rate is a strong indicator of client satisfaction and value delivery.
- The Threat: Losing clients is often silent. They don't always leave dramatically; they just stop engaging, or a competitor swoops in.
- The Prevention: Proactive account management, consistent communication, and demonstrating ongoing value.
Client Lifetime Value (CLTV)
The total revenue a client is expected to generate over their entire relationship with your agency. This shifts focus from single projects to long-term partnerships.
- The Calculation (Simplified): Average Annual Revenue Per Client x Average Client Lifespan (in years).
- The Impact: Understanding CLTV helps you prioritize clients, invest in account management, and make strategic decisions about which clients are most valuable to nurture.
Are you investing enough in your existing relationships?
Where Revue Fits In
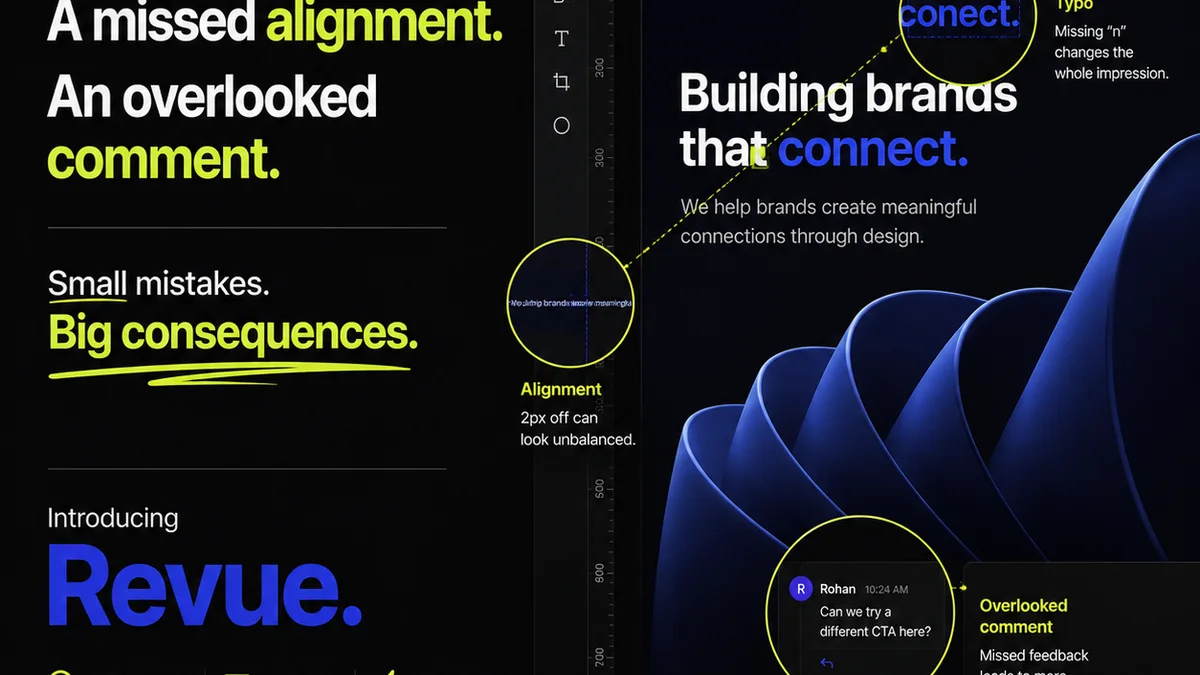
Managing these KPIs effectively requires visibility and control over your creative workflow. That’s where a tool like Revue becomes essential.
Centralized Feedback: Stop chasing scattered emails and Slack messages. Revue consolidates all client feedback in one place, linked directly to the creative asset. This reduces misinterpretations and speeds up the review cycle, directly impacting project timelines and budget adherence.
Revision & Approval Tracking: Know exactly where a project stands. Revue provides a clear audit trail of feedback, revisions, and approvals. This transparency helps manage scope creep, ensures everyone is aligned, and provides data for analyzing bottlenecks in your revision process.
Quality Assurance: By streamlining feedback and approvals, Revue helps ensure that the final output meets client expectations. This reduces costly rework and contributes to higher client satisfaction and retention rates.
Revue isn’t just about making things look pretty; it’s about making your operations run smoother, so you can focus on delivering great work and hitting those critical KPIs.
Final Thought
Are you managing your agency based on what happened, or are you proactively shaping what *will* happen? The difference lies in focusing on the operational KPIs that reveal the true health of your business, not just the surface-level outcomes. It’s about building a more resilient, profitable, and predictable agency.
Frequently asked questions
What are the most important KPIs for a creative agency?
Focus on operational KPIs like Profitability Per Project, Team Utilization & Efficiency, Project Delivery Performance (on-time, on-budget), and Client Retention Rate. These offer deeper insights than vanity metrics.
Why is 'Profitability Per Project' crucial?
It's the bedrock of agency health. If individual projects aren't profitable, overall agency success is unsustainable. It forces you to track true costs and identify inefficiencies.
What's a healthy utilization rate for agency staff?
Aim for 70-85%. Chasing 100% leads to burnout and reduced quality. This range allows for billable work plus essential non-billable activities like training and strategic thinking.
How can an agency improve client retention?
Focus on consistent communication, proactive account management, and demonstrating ongoing value beyond project delivery. Track Client Lifetime Value to understand which relationships to nurture.