Everyone talks about creative analytics. They point to engagement rates, likes, shares, and click-throughs. They tell you how many people saw your ad or visited your landing page.
None of that is wrong. But it’s incomplete.
The hard truth? Those surface-level metrics are often vanity plays. They feel good, but they don’t necessarily translate to real business impact for your agency or your clients. True creative analytics digs deeper, connecting creative output to tangible business outcomes like client retention, project profitability, and team efficiency.
1. Defining Your Core Metrics: What Actually Moves the Needle?
Before you can measure anything, you need to know what you’re measuring *for*. Forget the generic dashboards for a moment. What are the key performance indicators (KPIs) that directly impact your agency’s health and your clients’ success?
Client Retention & Satisfaction
Are your clients sticking around? Are they happy with the work and the process? Analytics here isn't just about project completion; it's about the long-term relationship.
- Repeat business rate
- Client lifetime value (CLV)
- Net Promoter Score (NPS) – if you track it post-project
- Number of active clients vs. churned clients
Project Profitability
This is the lifeblood of your agency. Are you making money on the work you do?
- Project profit margin
- Billable hours vs. non-billable hours (and where the non-billable time goes)
- Scope creep indicators (e.g., number of revision rounds beyond initial agreement)
- On-time delivery rate
Team Efficiency & Productivity
A happy, efficient team delivers better work, faster.
- Task completion time (for key stages)
- Resource utilization rates
- Internal feedback loop speed (how quickly are internal reviews completed?)
- Team capacity vs. workload
Creative Performance (Client-Focused)
This is where you connect creative output to client goals, but think beyond simple engagement.
- Conversion rates tied to specific creative assets
- Cost per acquisition (CPA) driven by campaign creative
- Brand sentiment shifts (if measurable via social listening tools)
- Lead quality generated from creative efforts
These are not trendy metrics. They are the operational metrics that determine if your agency is growing, profitable, and sustainable.
2. Measuring Creative Output: From Brief to Final Delivery
How do you track the actual creation process? This is where many agencies fall short, relying on gut feelings or scattered spreadsheets.
Brief Clarity and Adherence
A good brief is the foundation of good creative. Analytics can tell you if your briefs are effective and if the creative is staying on track.
- Number of significant deviations from the original brief
- Frequency of clarification questions from the creative team
- Alignment of final output with initial brief objectives (qualitative, but can be tracked via review notes)
Revision and Approval Cycles
This is a notorious bottleneck. Tracking it is crucial for understanding efficiency and client collaboration.
- Average number of revision rounds per project type
- Time spent in each revision/approval stage
- Number of stakeholders involved in approvals
- Frequency of feedback changes or conflicting feedback
Quality Assurance (QA) Checks
Are you catching errors before they go live? This impacts client trust and your agency’s reputation.
- Number of errors identified during internal QA
- Type of errors identified (e.g., copy, design, functionality)
- Time spent on QA per project
- Number of errors caught *after* client approval (the ones you *really* want to avoid)
The goal here isn't to blame. It's to identify patterns and friction points in your workflow.
3. Connecting Creative to Client Business Goals
This is the ultimate test. Does the creative work you deliver actually achieve what the client hired you to do?
Campaign Performance Metrics
Tie your creative directly to campaign objectives. This requires integration with client data or clear reporting structures.
- Click-Through Rates (CTRs) on ads and emails
- Conversion Rates (CR) for specific landing pages or offers
- Return on Ad Spend (ROAS) for paid media campaigns
- Engagement rates (likes, shares, comments) – but only as a *secondary* indicator, tied to a business goal.
Website and User Behavior
How does the creative impact what users do on the client’s website?
- Bounce rate on pages featuring new creative
- Time on page for content pieces
- Goal completions (e.g., form fills, downloads)
- User flow analysis to see if creative directs users as intended
Brand Perception and Awareness
While harder to quantify, some metrics can indicate shifts.
- Social media mentions and sentiment analysis
- Direct traffic increases to the client’s website
- Search volume for brand-related terms
This requires a partnership with your clients. You need access to their data, or a clear agreement on how you’ll measure shared goals.
4. Tools and Technologies for Creative Analytics
You can’t track what you don’t measure. And you can’t measure effectively without the right tools.
Project Management Platforms
These are your operational backbone.
- Revue: Centralizes feedback, tracks revisions, streamlines approvals, and flags potential bottlenecks. Essential for understanding workflow efficiency.
- Asana, Monday.com, ClickUp: General task and project tracking.
Creative Asset Management (DAM)
Organize and track your creative files.
- Bynder, Canto, Brandfolder: Track asset usage, version control, and distribution.
Web Analytics
Understand user behavior on client websites.
- Google Analytics: The standard for website traffic and user behavior.
- Adobe Analytics: A more enterprise-level option.
Marketing Automation & CRM
Connect creative efforts to lead generation and sales.
- HubSpot, Marketo, Salesforce: Track campaign performance, lead nurturing, and customer journeys.
Specialized Creative Performance Tools
Tools that offer deeper insights into specific creative types.
- Heatmap and session recording tools (e.g., Hotjar, Crazy Egg)
- Social media analytics platforms (e.g., Sprout Social, Hootsuite)
- A/B testing platforms (e.g., Optimizely, Google Optimize)
The key is integration. Data silos kill insights. Your tools should ideally talk to each other or provide a unified dashboard.
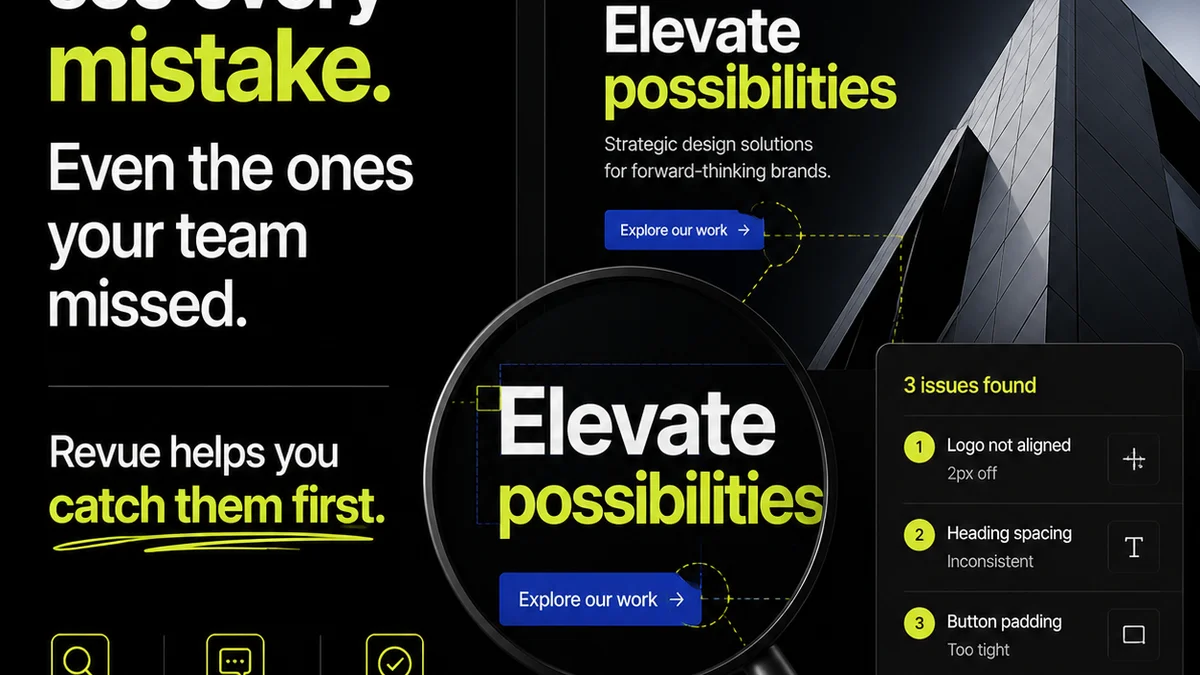
5. Where Revue Fits In
Let’s be honest. Managing creative workflows and feedback is messy. Scattered emails, endless Slack threads, version control nightmares – it all hides valuable data.
Revue is built to bring clarity to that chaos.
By centralizing all client feedback in one place, you gain immediate visibility into communication patterns. Every comment, every revision request, every approval is logged.
This isn’t just about tidiness. It’s about actionable data.
- Track Revision Cycles: See exactly how many rounds of feedback each project typically takes. Identify clients or project types that consistently require more iterations.
- Monitor Approval Speed: Understand where delays are happening. Is it internal reviews, client stakeholders, or something else?
- Centralize Feedback: No more hunting through inboxes. All feedback lives with the asset, making it easy to see changes over time and measure adherence to the brief.
- Improve QA: By having a clear history of feedback and revisions, your QA process becomes more informed and efficient, catching more errors earlier.
Revue turns your messy creative process into a trackable, measurable operation. It provides the foundational data for understanding your team’s efficiency and client collaboration dynamics – the real drivers of profitability and client satisfaction.
6. Final Thought
Are you measuring what truly defines success for your agency, or just what’s easy to count? The shift from vanity metrics to operational and business-impact metrics is the single most important step you can take to build a more profitable, sustainable, and client-centric creative business. It’s time to look beyond the likes and start measuring what matters.
Frequently asked questions
What are vanity metrics in creative analytics?
Vanity metrics are surface-level numbers that look good but don't necessarily correlate with business success. Examples include raw follower counts, likes, and general engagement without context. They don't directly inform profitability or client retention.
How can I measure creative project profitability?
Measure project profitability by tracking key metrics like project profit margin, the ratio of billable to non-billable hours, and the number of revision rounds compared to the initial scope. Tools that track time and project scope are crucial for this.
What's the difference between creative analytics and marketing analytics?
Marketing analytics focuses on the performance of marketing campaigns (e.g., ad spend, lead generation). Creative analytics dives deeper into the efficiency and impact of the creative *process* itself – how the work is made, revised, approved, and how that directly affects project profitability and client satisfaction, in addition to campaign outcomes.
How does feedback management relate to creative analytics?
Effective feedback management is a core component of creative analytics. By centralizing and tracking feedback, revisions, and approvals, you gain critical data on workflow bottlenecks, team efficiency, client collaboration, and the true cost of creative iteration. This data is essential for operational improvement and profitability.