Everyone talks about creative analytics. They point to engagement rates, click-throughs, and conversion numbers. They tell you what’s working and what isn’t.
None of that is wrong. But it’s incomplete. Especially for large, enterprise-level creative operations.
The hard truth? Most enterprise creative teams are drowning in data but starved for actionable insight. They’re measuring the *what* but missing the *why* and the *how*.
1. The Vanity Metric Trap
For enterprise teams, the pressure to show ROI is immense. This often leads to a focus on surface-level metrics. Think likes, shares, and basic views. These are easy to track and report, but they don’t tell the full story of creative effectiveness or operational efficiency.
This obsession with easily digestible numbers means we miss the deeper currents.
Why It Happens
- Pressure from leadership for quick wins.
- Lack of integrated tools to capture richer data.
- Teams siloed, with no clear ownership of comprehensive analysis.
- Focus on campaign performance over long-term brand health.
When you only look at the top line, you can easily mistake activity for impact. You might see a spike in engagement, but was it the right audience? Did it lead to actual business objectives being met?
2. Connecting Creative Output to Business Outcomes
This is where enterprise analytics needs to get serious. It’s not just about tracking how many assets were produced or how many people saw them. It’s about understanding the direct and indirect impact of that creative work on the business.
What does that actually look like?
Deeper Metrics to Consider
- Lead Quality: Did the creative campaign attract leads that are more likely to convert, or just more leads?
- Customer Lifetime Value (CLV): Can you tie specific creative touchpoints to customers who spend more over time?
- Brand Perception Shifts: Are your campaigns moving the needle on key brand health metrics (awareness, consideration, preference) among target segments?
- Internal Efficiency: How does creative throughput affect project timelines and budget adherence? Are revisions slowing down critical launches?
This requires a more sophisticated approach to data collection and analysis. It means integrating data from CRM, sales platforms, brand tracking studies, and your creative production tools.
3. The Operational Data You’re Ignoring
Most discussions about creative analytics focus on the *output* of the creative work. What about the *input* and the *process*?
For enterprise teams, the operational side is a goldmine for efficiency and effectiveness.
Key Operational Metrics
- Revision Cycles: How many rounds of revisions are typical for different asset types? Where are the bottlenecks?
- Feedback Turnaround Time: How long does it take stakeholders to provide feedback? Is it timely and constructive?
- Approval Latency: How long does it take for final approvals? Are there specific stakeholders or departments that consistently delay the process?
- Resource Allocation: Are you assigning the right people to the right tasks? Is your team over-allocated or under-utilized on specific project types?
- Asset Reusability: How often are existing assets being repurposed vs. new ones being created from scratch?
Understanding these operational metrics can reveal significant inefficiencies. Fixing these can free up creative resources, reduce costs, and speed time-to-market—all of which have a direct impact on the bottom line.
4. Building a Unified Data Picture
The biggest hurdle for enterprise creative teams is fragmentation. Data lives in a dozen different places: project management tools, DAMs, review platforms, marketing automation, analytics suites, spreadsheets.
Without a way to connect these dots, your analytics will always be partial.
Steps to Unification
- Audit Your Tools: What systems are you currently using? What data do they hold?
- Identify Key Integrations: Where can you connect systems to share data? (e.g., connecting your DAM to your project management tool).
- Establish Data Governance: Define what data is critical, who owns it, and how it should be standardized.
- Invest in a Central Hub: Look for platforms that can aggregate and analyze data from various sources.
This isn’t about building a complex data warehouse from scratch. It’s about strategically connecting the systems you already have to get a clearer, more holistic view.
Where Revue Fits In
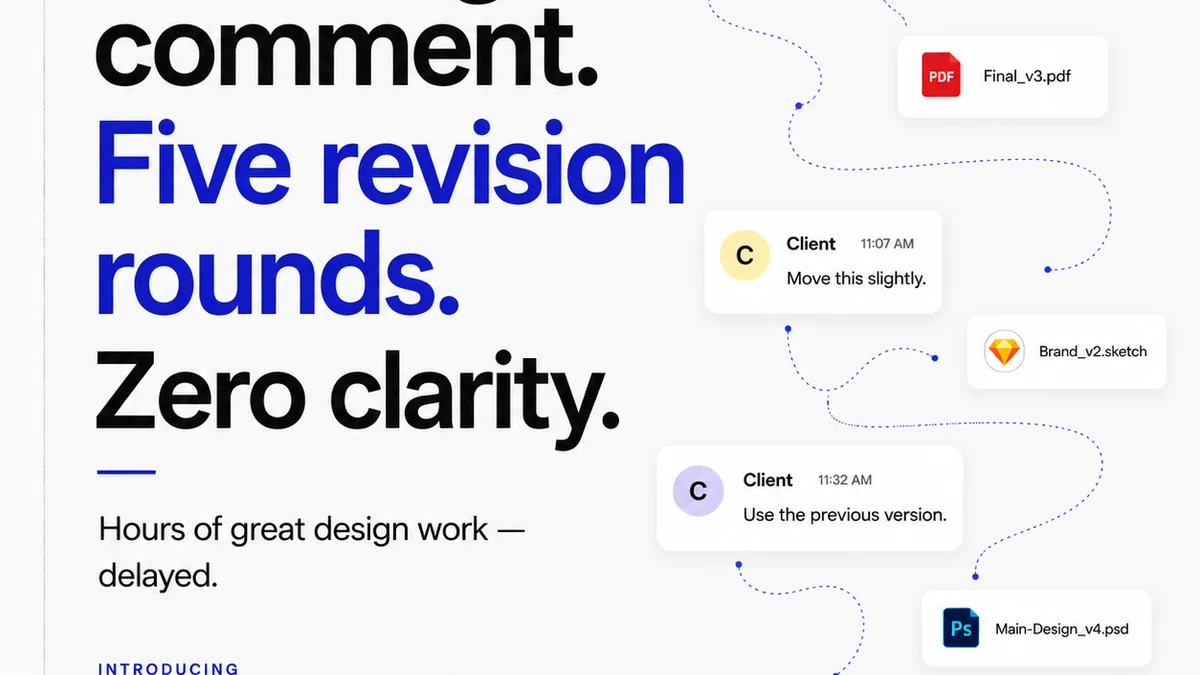
Managing creative feedback, revisions, and approvals is a critical, yet often opaque, part of the creative workflow. The data generated here is invaluable for understanding operational bottlenecks and creative friction points.
Revue provides a centralized platform where all client feedback, revision requests, and final approvals are logged. This creates a clear, auditable trail.
- Centralized Feedback: All comments and markups are in one place, linked to specific versions of creative assets. No more digging through emails or scattered documents.
- Revision Visibility: Track the history of changes, understand the scope of revisions, and identify patterns in feedback that might indicate miscommunication or unclear briefs.
- Approval Tracking: Monitor how long approvals are taking, who is responsible, and where delays occur. This data can highlight process inefficiencies or individuals who need additional support.
- Quality Control Data: By standardizing review and approval processes, you can ensure a consistent level of quality and adherence to brand guidelines across all creative output.
By bringing structure and visibility to this stage of the creative process, Revue generates operational data that directly informs your analytics. You can start to see how efficient feedback loops impact project timelines, how clear approvals reduce rework, and ultimately, how a smoother review process contributes to faster, better creative delivery.
5. Acting on Insights, Not Just Reporting Them
Having data is one thing. Doing something with it is another. The most effective enterprise teams use analytics to drive tangible change.
This means moving beyond the quarterly report and embedding insights into daily operations.
From Data to Action
- Regular Team Reviews: Discuss key metrics and insights with your creative and production teams.
- Process Optimization Workshops: Use data to identify specific pain points and brainstorm solutions.
- Stakeholder Education: Share relevant insights with clients or internal stakeholders to improve brief quality and feedback timeliness.
- Iterative Improvement: Treat analytics as an ongoing process, not a one-off project. Continuously test, learn, and adapt.
The goal is to foster a culture of continuous improvement, powered by data.
Final Thought
Are you truly measuring the success of your enterprise creative team, or just tracking activity? The difference between the two isn't just semantic; it's the difference between driving real business value and simply going through the motions. What's one operational metric you've been overlooking that could unlock significant efficiency for your team?
Frequently asked questions
What are vanity metrics in creative analytics?
Vanity metrics are numbers that look good on paper but don't necessarily correlate with business success. Examples include likes, shares, and basic page views, which don't always translate to leads, sales, or brand loyalty.
How can enterprise creative teams connect creative work to business outcomes?
By integrating data from various sources like CRM, sales platforms, and brand tracking studies. Focus on metrics like lead quality, customer lifetime value, and brand perception shifts, rather than just engagement rates.
What operational data is crucial for enterprise creative teams?
Key operational data includes revision cycle times, feedback turnaround time, approval latency, resource allocation efficiency, and asset reusability. Analyzing these reveals bottlenecks and areas for improvement.
Why is data fragmentation a problem for enterprise creative analytics?
Fragmentation means data is scattered across multiple tools (PM, DAM, review platforms), making it difficult to get a holistic view. Unifying this data through integrations and central hubs is essential for actionable insights.
How can tools like Revue help with creative analytics?
Revue centralizes feedback, revision history, and approval tracking, generating valuable operational data. This visibility helps identify workflow inefficiencies, speed up delivery, and ensure consistent quality, which can be integrated into broader analytics.