Everyone talks about creative analytics. They say you need it to understand your audience, optimize campaigns, and prove ROI. None of that is wrong.
But it’s incomplete.
The hard truth? Most creative analytics initiatives fail not because the data is bad, but because the *approach* is backward. You’re focused on the wrong metrics, at the wrong time, for the wrong reasons. You’re drowning in dashboards instead of making better creative.
This guide cuts through the noise. We’ll show you how to build an analytics practice that actually helps you make smarter creative, streamline workflows, and grow your agency.
1. What Creative Analytics Isn't (And Why That Matters)
The Vanity Metric Trap
The most common mistake is chasing vanity metrics. Likes, shares, impressions – these are easy to track, but they rarely tell you what matters. They don’t tell you if your creative is effective. They don’t tell you if your client’s business is growing.
Your client doesn’t pay you for engagement. They pay you for results. Period.
The "Build It And They Will Come" Fallacy
Another mistake is setting up complex analytics platforms and expecting insights to magically appear. You need a strategy. You need to know what questions you’re trying to answer *before* you dive into the data.
Without a clear objective, analytics becomes a time-suck. A distraction. A shiny object.
The Data Silo Nightmare
Too often, creative teams operate in one silo, and analytics teams in another. Creative produces work based on intuition and past experience. Analytics reports on what happened, but rarely informs what *should* happen next.
This disconnect is a killer. It breeds missed opportunities and wasted budget.
2. The Real Goal: Actionable Insights, Not Just Data
From Data Points to Decisions
Creative analytics isn’t about collecting numbers. It’s about transforming those numbers into clear, actionable insights that drive better creative decisions.
What does that look like in practice?
- Identifying which visual elements resonate most with a target audience.
- Understanding which messaging angles lead to higher conversion rates.
- Pinpointing the exact point in the customer journey where creative is failing.
- Measuring the impact of design choices on user behavior and business outcomes.
- Proving the value of creative work with concrete, business-relevant metrics.
Focus on the "Why" and "So What?"
Every metric you track should have a clear answer to: Why are we measuring this? And so what if the number changes?
If you can’t answer these questions, you’re wasting your time.
3. Building Your Creative Analytics Framework
Start with Business Objectives
What does success look like for your client? Is it more sales? Higher customer retention? Increased brand awareness? Your analytics should tie directly back to these core objectives.
Don't start with a tool. Start with a goal.
Identify Key Performance Indicators (KPIs)
Once you have objectives, define the KPIs that will measure progress. These should be specific, measurable, achievable, relevant, and time-bound (SMART).
Examples:
- For a lead-gen campaign: Cost Per Lead (CPL), Conversion Rate of Landing Page
- For an e-commerce campaign: Return on Ad Spend (ROAS), Average Order Value (AOV), Cart Abandonment Rate
- For a brand awareness campaign: Share of Voice, Website Traffic Growth, Branded Search Volume
Choose the Right Tools (and Tactics)
You don’t need a massive, enterprise-level platform to start. Often, the tools you already use provide valuable data. Think about:
- Website Analytics: Google Analytics, Adobe Analytics (for traffic, user behavior, conversions)
- Social Media Analytics: Native platform insights (Facebook, Instagram, LinkedIn, etc. for reach, engagement, demographics)
- Ad Platform Analytics: Google Ads, Meta Ads Manager (for campaign performance, CPA, ROAS)
- CRM Data: Salesforce, HubSpot (for lead quality, customer lifetime value)
- Surveys & Feedback Tools: Typeform, SurveyMonkey (for direct qualitative insights)
The key is integrating these sources.
Define Your Analysis Process
Who is responsible for pulling the data? Who analyzes it? Who translates it into insights? Who presents it to the client?
Having a defined process prevents data from languishing in spreadsheets.
4. Measuring Creative Effectiveness: Beyond the Surface
A/B Testing: The Gold Standard
This is non-negotiable for serious creative optimization. Test variations of headlines, calls-to-action, images, and even entire layouts.
What works best? The data will tell you.
Qualitative Feedback Loops
Numbers can’t tell you *why* something isn’t working. That’s where qualitative data comes in. User interviews, focus groups, and even analyzing client feedback can reveal crucial insights.
Listen to your users. Listen to your clients.
Content Performance Analysis
Break down your content by format, topic, and channel. Which blog posts drive the most traffic? Which videos get the most watch time? Which social posts generate the most qualified leads?
This helps you understand what resonates and why.
Conversion Path Analysis
Map the journey users take from first touchpoint to conversion. Where are they dropping off? Are there specific creative assets or messages that help them along the way?
Optimize the path. Improve the outcome.
5. Where Revue Fits In
Centralized Feedback & Clarity
Creative development is rarely linear. Feedback comes from everywhere – clients, internal stakeholders, different departments. Without a system, this feedback becomes chaotic, leading to misinterpretations and wasted revisions.
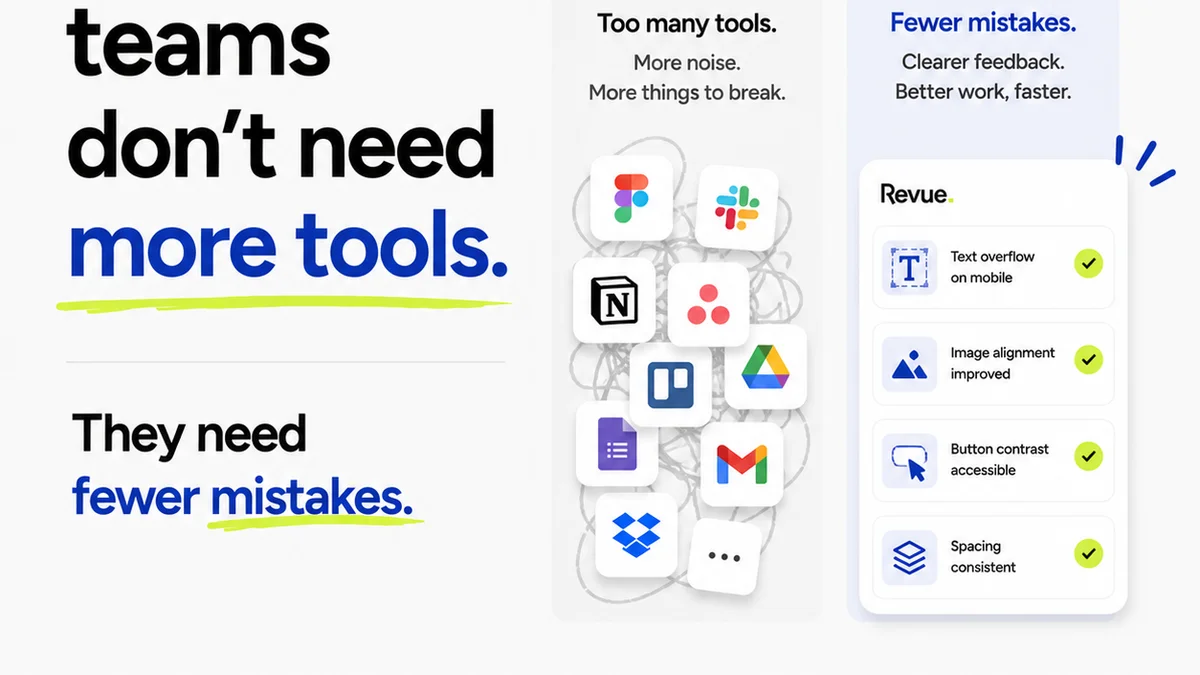
Revue acts as your single source of truth for all creative feedback. Comments are tied directly to specific versions, elements, and project stages.
Revision & Approval Visibility
Knowing *who* approved *what* and *when* is critical. Manual tracking is error-prone and leads to endless
Frequently asked questions
What is the difference between creative analytics and general marketing analytics?
Creative analytics specifically focuses on measuring the performance and impact of creative assets (visuals, copy, design) on user behavior and business outcomes, whereas general marketing analytics takes a broader view of all marketing activities.
How can I start implementing creative analytics if I have a small budget?
Start by leveraging the built-in analytics of platforms you already use (social media, ad platforms, website analytics). Focus on defining clear objectives and tracking a few key metrics that directly relate to those goals. Qualitative feedback is also a low-cost, high-value source of insight.
What are the most important metrics for creative analytics?
The most important metrics depend on your specific goals. However, key metrics often include conversion rates, click-through rates (CTR), cost per acquisition (CPA), return on ad spend (ROAS), engagement rates, time on page, and qualitative feedback scores. Always tie metrics back to business objectives.
How often should I review my creative analytics?
The frequency depends on the pace of your campaigns and the type of data. For active ad campaigns, daily or weekly reviews might be necessary. For content performance or brand metrics, weekly or monthly reviews can be sufficient. The key is consistency and timely action.