Everyone talks about creative analytics. They talk about engagement rates, click-throughs, conversion numbers. They talk about what works and what doesn’t.
None of that is wrong. But it’s incomplete.
The hard truth? Most creative analytics are backward-looking. They tell you what *happened*. They don’t tell you *why* it happened, or what to do differently next time.
Creative analytics, when done right, isn’t just about reporting past performance. It’s about understanding the underlying mechanics of your creative output and using that knowledge to make smarter decisions, faster.
1. Beyond Vanity Metrics: What Actually Matters
Vanity metrics are the shiny objects of the analytics world. Likes, shares, follower counts. They feel good. They look good on a slide deck. But do they actually move the needle for your business?
Rarely.
Real creative analytics focuses on metrics that tie directly to business objectives. For an agency, this might mean:
- Client satisfaction scores (and how they correlate with project scope and revision rounds)
- Project profitability (broken down by client, by project type, by team member)
- Client retention rates (and the factors that influence them)
- Proposal win rates (and the impact of specific case studies or pitch elements)
For an in-house team, it could be:
- Internal team efficiency (time spent on revisions vs. initial creative work)
- Brand consistency across campaigns (measured by deviations from brand guidelines)
- Impact of creative assets on downstream business goals (e.g., leads generated, sales qualified opportunities)
- Employee satisfaction with creative tools and processes
It’s about connecting creative effort to tangible business outcomes.
2. The Data You Need (And How to Get It)
Collecting the right data is the first hurdle. Many teams operate with fragmented systems, making a holistic view impossible.
Think about it: feedback scattered across emails, revisions tracked in spreadsheets, approvals buried in chat threads. This isn’t data; it’s noise.
You need systems that capture:
Client Feedback Data
- Centralized feedback logs
- Sentiment analysis of feedback (positive, negative, neutral)
- Frequency and nature of feedback per asset
- Which stakeholders provide the most impactful feedback
Revision and Approval Data
- Number of revision rounds per project/asset
- Time spent in revision cycles
- Bottlenecks in the approval process
- Which versions were approved and when
Project Performance Data
- Project timelines vs. estimates
- Resource allocation vs. actual time spent
- Profitability per project
- Client communication frequency and responsiveness
This data often lives in project management tools, CRM systems, financial software, and communication platforms. The challenge is integrating it.
3. Identifying Creative Bottlenecks and Inefficiencies
Analytics reveal patterns. And patterns often highlight where your creative process is breaking down.
Is a particular client consistently requiring more revisions than others? Is a specific type of project always running over budget?
Are your designers spending 50% of their time managing feedback instead of designing?
These aren’t just operational headaches; they’re drains on profitability and team morale.
Common bottlenecks include:
- Unclear briefs
- Scope creep
- Delayed client feedback
- Inefficient review cycles
- Lack of clear approval processes
- Poor version control
Analytics helps you pinpoint these issues with data, not just gut feeling.
4. Measuring Creative Impact, Not Just Output
This is the holy grail. Moving beyond *how many* assets you produced to *how well* they performed.
For marketing teams, this means linking creative to campaign goals. Did that new ad creative actually increase click-through rates? Did the landing page redesign improve conversion rates?
For agencies serving clients, it means demonstrating the ROI of your creative work.
This requires a deeper integration with performance marketing platforms, sales data, and web analytics. It’s about closing the loop.
It’s no longer enough to deliver beautiful work. You have to deliver work that *works*.
5. The Human Element: Analytics and Team Performance
Creative analytics isn't just about clients and campaigns. It’s also about your team.
Are your creatives burnt out? Are they spending too much time on administrative tasks?
Analytics can provide insights into:
- Workload distribution
- Time spent on different types of tasks (creative vs. administrative vs. meetings)
- Project satisfaction scores (from the team's perspective)
- Correlation between project complexity and team stress levels
When used constructively, this data can help you optimize workflows, provide better support, and build a more sustainable creative environment. It’s about empowering your people, not policing them.
Where Revue Fits In
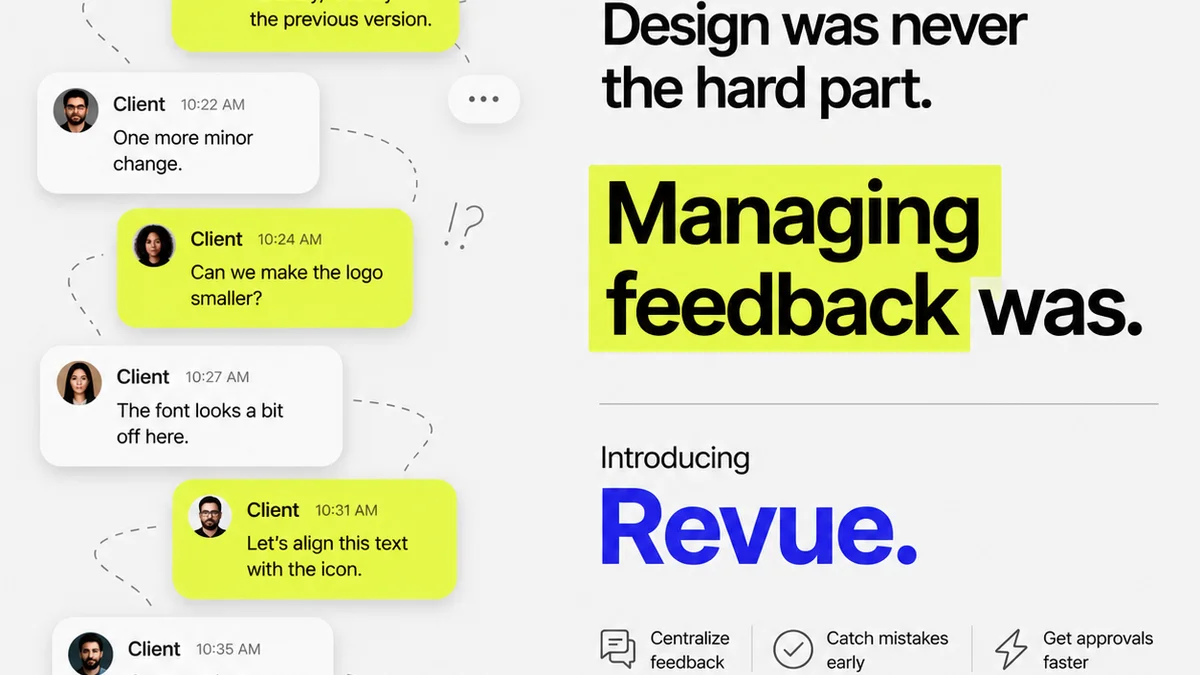
Managing creative feedback, revisions, and approvals is a massive part of the creative workflow. It’s also a major source of friction and lost time.
Revue acts as a central hub for this entire process. By consolidating feedback and managing revisions within a single platform, you create a clean, auditable trail of communication and decision-making.
This provides invaluable data:
- Centralized Feedback: All comments, annotations, and discussions are in one place, linked to specific versions. No more hunting through emails.
- Revision Visibility: Track every iteration, understand the changes made, and see who approved what, and when.
- Approval Tracking: Clear, unambiguous sign-offs that eliminate confusion and disputes.
- Quality Checks: Ensure all necessary stakeholders have reviewed and approved before final delivery.
This structured data stream is foundational for meaningful creative analytics. You can’t analyze what you can’t reliably track.
Final Thought
Are you measuring the right things? Or are you just looking at the numbers that are easiest to find?
The real power of creative analytics lies not in reporting the past, but in shaping the future. It’s about building a smarter, more efficient, and more impactful creative engine.
What will you choose to measure next?
Frequently asked questions
What are vanity metrics in creative analytics?
Vanity metrics are superficial measures that look good but don't contribute to business goals, such as likes, shares, or follower counts. True creative analytics focuses on metrics tied to business outcomes like client satisfaction, project profitability, or retention rates.
How can I track client feedback effectively?
Effective tracking involves centralizing all feedback in one place, such as a dedicated platform. This allows you to log comments, analyze sentiment, track frequency, and identify which stakeholders provide the most impactful input, rather than relying on scattered emails or messages.
What's the difference between creative output and creative impact?
Creative output refers to the volume of work produced (e.g., number of designs). Creative impact measures how well that work performed against business objectives, such as increased conversion rates, improved brand perception, or higher sales qualified opportunities.
How does a tool like Revue help with creative analytics?
Revue centralizes client feedback, revision tracking, and approval processes. This structured data stream provides the reliable, auditable information needed to perform meaningful analytics on your creative workflow, identifying bottlenecks and measuring efficiency.