Everyone’s obsessed with data. Especially creative teams. They want to know what’s working, what’s not, and why. So they track clicks, impressions, engagement rates, conversion numbers. They build dashboards. They pore over spreadsheets. They talk about ROI.
None of that is wrong. But it’s incomplete.
The hard truth? Most teams are measuring the wrong things, or measuring the right things in the wrong way. They’re mistaking activity for impact, and vanity metrics for real business value. This isn’t about blaming anyone. It’s about understanding a fundamental disconnect between creative output and business objectives.
1. The Vanity Metric Trap
This is the most common pitfall. We love numbers that look good, even if they don't tell the whole story. A million impressions? Amazing! 10,000 likes? Incredible! But what did that actually *do* for the business?
Vanity metrics are those that make you look good but don’t necessarily correlate with business goals. They are easy to measure, but hard to act on.
Examples of Vanity Metrics:
- Total website visitors (without segmentation)
- Social media followers (without engagement context)
- Page views (without conversion tracking)
- Video views (without completion rates or downstream actions)
- “Likes” and “Shares” (without a clear link to sales or leads)
These numbers can be a starting point, but they’re rarely the destination. You need to dig deeper.
2. The Disconnect Between Creative and Business Goals
Creative teams are often tasked with goals that aren't directly tied to revenue or core business objectives. Brand awareness, engagement, or even just “making something beautiful” are common. But how do you measure the ROI of beauty?
The real problem arises when these creative-specific goals aren't translated into measurable business outcomes. If the goal is brand awareness, the business goal might be increased market share or lead generation. If the creative goal is engagement, the business goal might be customer retention or increased lifetime value.
Bridging the Gap:
Start by asking stakeholders: “What does success look like for the business?” Then, work backward to define how the creative work contributes to that success.
- If the business goal is to increase sales by 10%, what creative campaign can directly influence that?
- If the business goal is to improve customer satisfaction, what content or design changes will impact that?
- If the business goal is to reduce customer support tickets, what educational content can the creative team produce?
When creative goals align with business goals, the metrics start to matter.
3. Measuring the Wrong Stage of the Funnel
Many teams focus too heavily on top-of-funnel metrics. They get excited about reach and impressions, but neglect what happens *after* someone sees their work. What do they do next? Do they convert? Do they become a loyal customer?
The entire customer journey matters. Analyzing only one part gives you a skewed perspective.
Consider the Full Funnel:
- Awareness: Impressions, Reach, Social Mentions. (Vanity potential is high here.)
- Consideration: Website Visits, Content Downloads, Email Sign-ups, Time on Site. (Getting warmer.)
- Decision: Demo Requests, Free Trial Sign-ups, Add-to-Cart, Purchases. (This is where real business value often shows.)
- Loyalty: Repeat Purchases, Customer Lifetime Value, Net Promoter Score (NPS). (The ultimate indicator of sustained success.)
Your analytics should reflect your overall business objectives, not just how many eyeballs you captured.
4. The Attribution Problem
This is the bane of every marketer’s existence. A customer sees a social ad, visits the website from a Google search, gets an email newsletter, and finally converts. Which touchpoint gets the credit? Most attribution models are flawed.
First-touch, last-touch, even linear models oversimplify complex customer journeys. They assign disproportionate value to one interaction, ignoring the cumulative effect of multiple touchpoints.
What’s the solution?
- Data-driven attribution: Uses machine learning to assign credit based on actual impact. (Often requires sophisticated tools and expertise.)
- Qualitative feedback: Ask customers directly how they found you. (Simple, effective, and often overlooked.)
- Focus on trends: Instead of pinpointing *the* single source, look at which channels consistently contribute to conversions over time.
Don't let imperfect attribution paralyze you. Use the best data you have and supplement with qualitative insights.
5. Ignoring Qualitative Data
Numbers tell you *what* is happening. People tell you *why* it’s happening. Relying solely on quantitative data means you’re missing crucial context.
What are people saying in the comments? What feedback are you getting on your designs? What are your sales and support teams hearing from customers?
This kind of feedback is gold. It can explain why a campaign flopped despite high engagement, or why a seemingly quiet campaign is driving significant high-quality leads.
Actionable Qualitative Insights:
- Social media comments and DMs
- Customer support tickets and transcripts
- Sales team call notes and CRM feedback
- User testing and interviews
- Direct client feedback on creative deliverables
Integrate this feedback into your analysis. It’s the missing piece of the puzzle.
6. The Tool vs. The Strategy
We buy fancy analytics tools. We set up complex dashboards. We spend hours configuring reports. And then we wonder why nothing changes.
Tools are just that: tools. They don’t create strategy. They don’t dictate action. They simply present data.
The real work is in interpreting that data, connecting it to business objectives, and making informed decisions. A beautiful dashboard is useless if no one knows what to do with it.
The Strategic Process:
- Define clear business objectives.
- Translate objectives into measurable KPIs.
- Choose the right metrics to track these KPIs.
- Select appropriate tools to gather data.
- Analyze data regularly, looking for trends and insights.
- Act on insights to optimize creative and strategy.
- Review and iterate.
Don’t get lost in the features of your analytics software. Focus on the strategy it’s supposed to support.
Where Revue Fits In
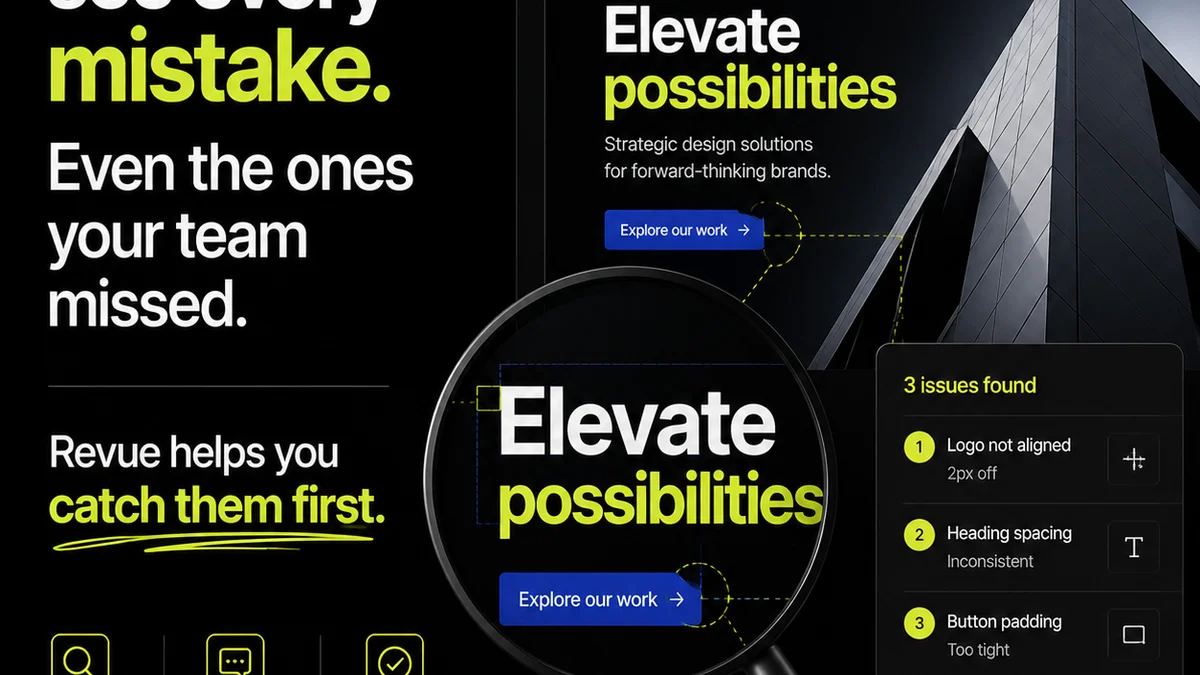
Managing creative feedback and approvals is a critical part of the workflow where data often gets lost or misinterpreted. Teams struggle to track which feedback led to which revisions, and how those revisions ultimately impacted the final deliverable and its performance.
Revue helps centralize this process. By keeping all client feedback, revision history, and approval stages in one place, you gain clarity. You can see:
- Which feedback points were addressed.
- Which versions were approved and by whom.
- How long each stage took.
- Any bottlenecks in the review cycle.
This visibility is crucial. It allows you to identify inefficiencies in your creative process that might be hindering performance. When you can directly link feedback to final output and then correlate that with performance data, you start to understand what truly drives success. It’s not just about tracking clicks; it’s about understanding the entire journey from initial concept to client sign-off and beyond.
Final Thought
Are you measuring what matters, or just what’s easy to count? The real value of creative analytics isn't in the numbers themselves, but in the actionable insights they provide to drive better business outcomes. It’s time to move beyond vanity and focus on impact.
Frequently asked questions
What are vanity metrics in creative analytics?
Vanity metrics are numbers that look good on paper but don't directly contribute to your core business objectives. Examples include total social media followers or website page views without context on conversion or engagement.
How can I ensure my creative analytics align with business goals?
Start by clearly defining overarching business objectives. Then, translate those into specific, measurable creative goals. Ask stakeholders what success looks like for the business and work backward to determine how creative efforts contribute.
What's the best way to handle the attribution problem in creative analytics?
While perfect attribution is difficult, focus on trends rather than pinpointing a single touchpoint. Use data-driven attribution models if possible, but don't underestimate the value of qualitative feedback like asking customers directly how they found you.
How does qualitative data improve creative analytics?
Quantitative data shows *what* is happening, but qualitative data explains *why*. Analyzing customer comments, support tickets, and direct feedback provides crucial context that numbers alone cannot offer, leading to better decision-making.
How can a tool like Revue help with creative analytics?
Revue centralizes feedback, revisions, and approvals, providing clear visibility into your creative workflow. This helps identify bottlenecks and inefficiencies, allowing you to connect creative process improvements directly to final deliverable performance and business impact.