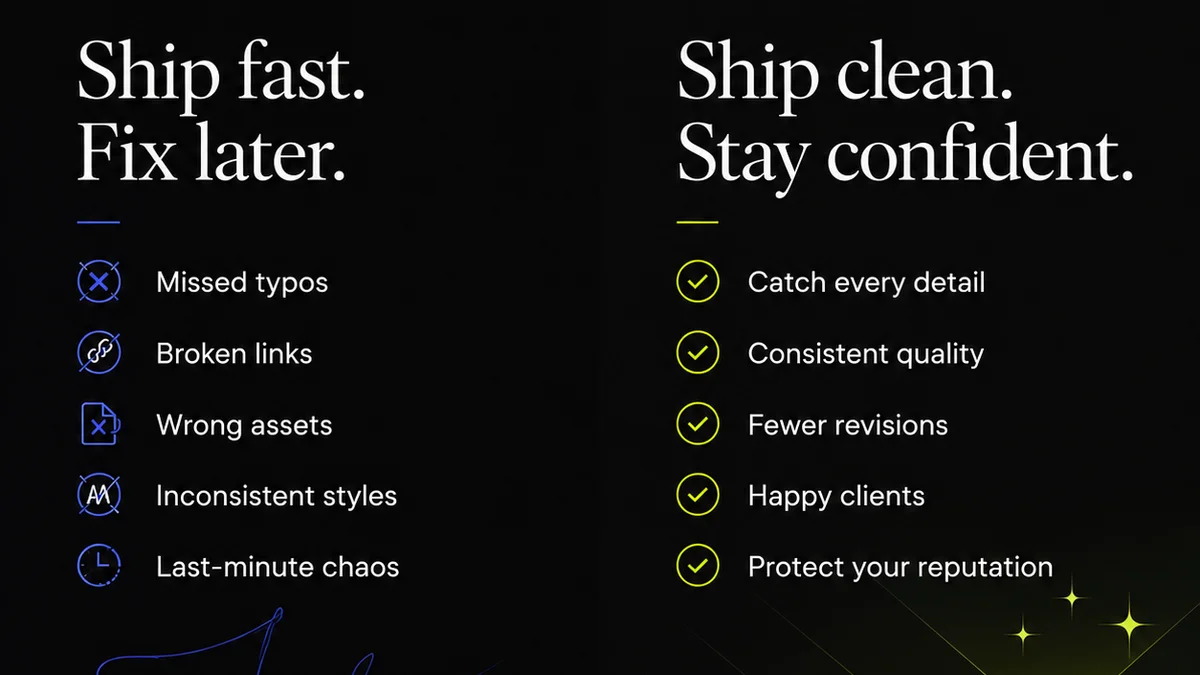
Everyone talks about KPIs. They’re supposed to be the north star for agency performance. You track billable hours, project profitability, client retention. All good stuff. Important stuff.
But when it comes to the actual creative output, the governance around it, the metrics often fall flat. We get bogged down in vanity numbers or chase proxies for quality that don't tell the full story.
None of that is wrong. But it’s incomplete.
The hard truth is that many agencies treat creative governance as a box-ticking exercise, not a performance driver. The KPIs they track are often superficial, measuring activity rather than impact. They focus on *if* a project went through a process, not *how well* it went through that process, or what that process *achieved*.
Real creative governance KPIs don't just track process; they measure the health and efficiency of your creative operations and, critically, the quality and effectiveness of the work produced.
1. Revision Cycles: Beyond the Count
The standard metric here is simple: how many revision rounds did a project take? This is often presented as a negative. Too many rounds? Inefficiency! Too few? Rushed work!
But the number of rounds is almost meaningless on its own. What matters is the *quality* of feedback and the *efficiency* within those rounds.
The Real Story in Revision Data
- Feedback Clarity Score: How often is feedback actionable and specific versus vague and contradictory? This requires a qualitative overlay, but you can gamify it by tracking the *percentage of feedback items that require follow-up clarification*. High clarification rates signal poor initial briefs or unclear communication.
- Time Per Revision Round: It’s not just about the *number* of rounds, but how long each round takes. Delays here point to bottlenecks in feedback delivery, internal review, or the actual revision work.
- Scope Creep Index: Track the percentage of revisions that fall outside the original brief or scope. This isn't necessarily bad if managed and priced correctly, but a high, unmanaged rate erodes profitability and stretches timelines.
- First-Round Acceptance Rate: What percentage of creative assets are approved (or move to final approval) after the first round of *meaningful* feedback? This is a strong indicator of initial brief quality and creative team understanding.
Counting revision rounds is like counting steps without knowing if you're walking towards a cliff or a destination. You need to know *why* you're taking those steps and if they’re productive.
2. Approval Timeliness: The Bottleneck Buster
Client approvals are notorious bottlenecks. Agencies often track the total time a project is in client review, but that's too broad.
We need to dissect the approval process itself.
Drilling Down into Approval Metrics
- Average Feedback Turnaround Time (Client): How long does it take clients to provide feedback once requested? Segment this by client to identify habitual slow responders.
- Average Internal Review Time: How long does it take internal stakeholders (CDs, Account Managers, etc.) to review creative before it goes to the client? This often hides internal inefficiencies.
- Time to Final Sign-off: The total elapsed time from initial submission to final, irrevocable approval. Breaking this down helps pinpoint where delays are most critical.
- Rejection Rate Post-Internal Review: What percentage of work is rejected by the client *after* it has already passed internal review? This highlights issues with internal quality control or subjective internal gatekeeping.
Speed isn't the only goal. Accuracy and informed decision-making are paramount. But understand where time is lost, and you can optimize the flow without sacrificing quality.
3. Briefing Effectiveness: The Foundation of Everything
You can't hit a target you can't see. If the brief is weak, the creative will be misdirected, leading to endless revisions and frustration. This is the most undervalued KPI area.
How do you measure a brief's effectiveness?
Quantifying Brief Quality
- Brief Completeness Score: Develop a checklist of essential brief components (objectives, audience, key message, deliverables, mandatories, budget, timeline). Track the percentage of briefs that meet this standard.
- Client Briefing Alignment: Post-project, survey clients (or internal teams who briefed the client) on how well the final output met the *original* brief's stated objectives.
- Briefing Clarification Rate: Similar to feedback, how many questions does the creative team need to ask *about the brief* before starting work? A high rate means the brief wasn't clear enough.
- Rework Attributable to Briefing Errors: This is tough but crucial. Can you directly link a certain percentage of revision rounds or scope creep to a flaw in the initial brief?
A perfect brief doesn't guarantee perfect creative, but it dramatically increases the odds. It sets expectations and provides a clear roadmap. Measuring its effectiveness means investing in better briefing practices.
4. Internal Collaboration & Handoffs
Creative agencies are complex ecosystems. Design hands off to copy, copy to development, development to QA. Each handoff is a potential point of failure or delay.
Governance here means ensuring smooth transitions.
Tracking Handoff Efficiency
- Handoff Error Rate: What percentage of assets require rework due to errors introduced during a handoff (e.g., incorrect specs, missing assets, broken links)?
- Time Spent on Handoff Rework: Quantify the hours spent fixing issues that arose purely from a poor handoff process.
- Cross-Team Communication Latency: Measure the average time it takes for a question or clarification to be resolved between different departments involved in a project.
This isn't about blame; it's about process optimization. Where are the friction points? How can we smooth them out?
5. Quality Assurance & Error Reduction
This is the final gate. But too often, QA is an afterthought, a quick scan rather than a rigorous check.
The goal is not just to catch errors, but to prevent them upstream.
Measuring True Quality Control
- Pre-Launch Error Rate: The number of critical errors caught by QA *before* an asset goes live or is delivered to the client.
- Post-Launch Error Rate: The number of errors discovered by the client or end-users *after* delivery. This is the ultimate failure metric for QA and overall governance.
- QA Cycle Time: How long does the QA process itself take? Is it efficient, or is it another bottleneck?
- Type of Errors Caught: Are you catching typos and broken links (basic QA), or are you catching strategic misalignment, brand inconsistencies, or usability issues (advanced QA)? The latter indicates a more mature process.
A robust QA process reduces costly mistakes, protects brand integrity, and builds client trust. It’s not a cost center; it’s a value protector.
Where Revue Fits In
Managing these KPIs effectively requires visibility and structure. Trying to track these metrics manually across spreadsheets, emails, and disparate project management tools is a recipe for frustration and inaccuracy.
This is where a centralized platform like Revue becomes invaluable.
Revue provides a single source of truth for creative assets and client feedback. This means:
- Centralized Feedback: All comments, annotations, and approvals live on the asset itself. No more hunting through email chains. This directly impacts your Feedback Clarity Score and reduces Time Per Revision Round.
- Version Control & Revision History: Every iteration is tracked. You can easily see the evolution of an asset, identify the source of changes, and measure the true number of *meaningful* revision cycles, not just file saves. This helps track your Revision Cycles and First-Round Acceptance Rate.
- Clear Approval Workflows: Define clear stages for internal and client review. This visibility allows you to measure Average Feedback Turnaround Time (Client) and Average Internal Review Time with precision. You can identify who is holding things up.
- Asset Management & Handoffs: Ensure all necessary files, specs, and context are attached to the final approved asset, streamlining your Handoffs and reducing Handoff Error Rates.
- Audit Trails: Every action is logged, providing an irrefutable record for tracking Scope Creep and understanding the entire project lifecycle for reporting and analysis.
By bringing structure and visibility to your creative workflow, Revue empowers you to move beyond vanity metrics and start tracking the KPIs that truly reflect operational health and creative quality.
Final Thought
Are you measuring the right things? Or are you just measuring things?
The difference between activity and progress, between busywork and impact, often lies in the metrics you choose to prioritize. Elevate your creative governance by focusing on KPIs that reveal the true health and effectiveness of your operations, not just the appearance of them.
Frequently asked questions
What are the most common mistakes agencies make when tracking creative KPIs?
The most common mistake is focusing on superficial metrics like the sheer number of revision rounds or total project time, rather than the quality of feedback, the efficiency within rounds, or the effectiveness of the initial brief. Agencies often measure activity instead of impact.
How can I measure the effectiveness of my creative briefs?
You can measure brief effectiveness by tracking metrics like brief completeness scores (ensuring all essential elements are present), the rate of clarification questions from the creative team about the brief, and ultimately, how well the final output aligns with the original brief objectives. Post-project client or internal team surveys can also be valuable.
Is it possible to quantify feedback quality?
Yes, it's possible to quantify aspects of feedback quality. You can track the percentage of feedback items that require follow-up clarification, the specificity of comments, or the rate at which feedback leads to approval versus requiring further iteration. This often involves a qualitative assessment combined with tracking patterns.
How does a platform like Revue help with creative governance KPIs?
Revue centralizes feedback, manages version control, and provides clear audit trails for approvals and revisions. This structure allows for precise tracking of metrics like time per revision round, client feedback turnaround time, and revision history, moving beyond manual, error-prone tracking.