Everyone talks about creative agency success in terms of billable hours, client retention, or award wins. Those are the shiny objects. The headlines.
None of that is wrong. But it’s incomplete.
The real engine of a thriving agency isn't just creative brilliance or client charm. It’s operational efficiency. It’s the unseen gears turning smoothly behind the scenes, turning ideas into profitable, repeatable results.
And you can’t improve what you don’t measure.
Here’s the hard truth: If you’re not tracking the right creative operations KPIs, you’re flying blind. You’re leaving money on the table, frustrating your team, and risking client relationships. It’s time to look beyond the obvious and dig into the metrics that actually matter for sustainable growth and sanity.
1. Project Profitability & Margin Health
This is the bedrock. If your projects aren't profitable, nothing else matters in the long run. It's not about having busy teams; it's about having teams working on projects that contribute to the bottom line.
Understanding True Project Cost
Many agencies track revenue, but not true cost. This means not just direct labor, but also overhead allocation, software costs, and even the time spent on non-billable tasks that keep projects moving.
- Are you accurately capturing all direct labor costs, including benefits and non-billable admin time?
- How are you allocating overhead (rent, utilities, software subscriptions, admin salaries) to projects?
- Do you account for the cost of external vendors and freelancers?
Without this granular understanding, you can’t accurately assess profit margins. You might be winning work, but losing money on it.
Margin by Project Type/Client
Once you know your true costs, you can start segmenting. Which types of projects consistently yield the highest margins? Which clients are your most profitable, and why?
This isn’t about firing clients; it’s about understanding the economics of your business. It informs pricing, resource allocation, and sales strategy. If a certain project type is consistently a margin-killer, you need to understand the root cause: is it scope creep, poor estimation, inefficient workflows, or simply the wrong pricing?
Realization Rate
This is your billable hours as a percentage of total hours worked on a project. A low realization rate signals issues with scope management, time tracking, or client expectations.
It’s a direct indicator of how effectively you’re converting effort into revenue. Low realization often means your team is working hard, but much of that work isn’t being billed. That’s a leaky bucket.
2. Resource Utilization & Allocation
Utilization is often touted as a key metric, but it’s a double-edged sword. High utilization isn’t always good. In fact, it can be a sign of burnout and inefficiency.
Billable vs. Non-Billable Time
Your team spends a lot of time on tasks that don’t directly bill to a client: internal meetings, training, admin, prospecting, and yes, even fixing mistakes or dealing with rework caused by unclear feedback.
Tracking the ratio of billable to non-billable time helps identify where operational friction occurs. If non-billable time is creeping up, it’s a red flag for process issues or excessive internal demands.
Capacity Planning & Over/Under-Allocation
Are you consistently over-allocating your best people, leading to burnout and missed deadlines? Or are you under-allocating, meaning key resources are sitting idle and not contributing to revenue?
Accurate capacity planning, informed by historical project data and team availability, is crucial. It prevents the reactive hiring or firing that cripples agency growth and stability.
Team Burnout Indicators
This isn’t a traditional KPI, but it’s critical. Look for trends in:
- Increased overtime hours
- Higher error rates
- More sick days or PTO requests
- Decreased team morale (harder to quantify, but essential to observe)
- High staff turnover
Burnout kills productivity, creativity, and profitability. It’s an operational cost you can’t afford to ignore.
3. Project Timeliness & Velocity
Deadlines are client promises. Missing them erodes trust and can lead to penalties or lost future business.
On-Time Delivery Rate
A straightforward metric: what percentage of projects or milestones are delivered by the agreed-upon deadline? This is a direct reflection of your planning, execution, and problem-solving capabilities.
Cycle Time (Task & Project)
How long does it take, on average, to complete a specific type of task or an entire project from kickoff to final delivery? Reducing cycle time means faster delivery, higher throughput, and often, better profitability (less time spent equals lower cost).
Look for bottlenecks. Where do projects consistently get stuck? Is it client review? Internal handoffs? Specific creative stages?
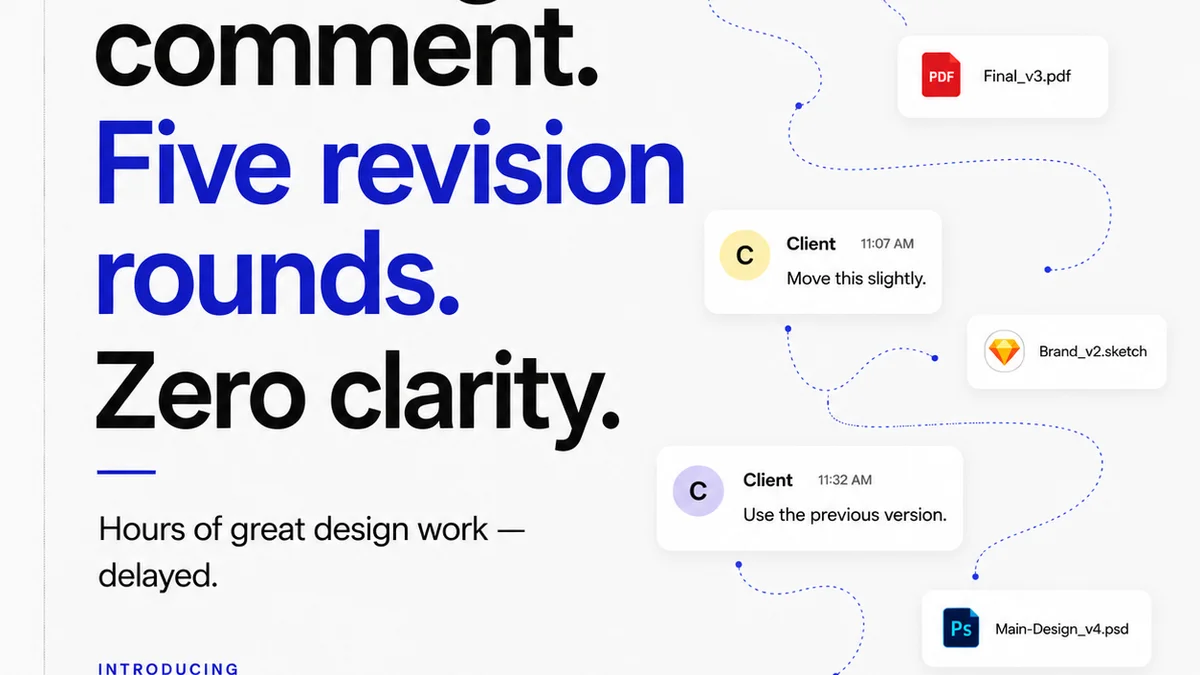
Rework Rate & Causes
This is a killer KPI. What percentage of project time is spent on rework? More importantly, *why* is rework happening?
- Unclear briefs?
- Scope creep?
- Poor client feedback (ambiguous, contradictory, out-of-scope)?
- Internal miscommunication?
- Insufficient quality checks?
High rework rates are a massive drain on resources and a major contributor to missed deadlines and reduced profitability. It’s often a symptom of deeper process failures.
4. Client Satisfaction & Feedback Quality
Happy clients lead to repeat business and referrals. But
Frequently asked questions
What are the most important creative operations KPIs for an agency?
The most important KPIs focus on project profitability, resource utilization, project timeliness, and client satisfaction. Specifically, tracking margin health, realization rate, on-time delivery, rework rate, and client feedback quality provides a comprehensive view of operational efficiency and business health.
How does tracking KPIs improve agency profitability?
By identifying unprofitable projects, understanding true project costs, managing resource allocation effectively, and minimizing rework, agencies can make data-driven decisions to increase margins, reduce waste, and ensure projects are financially viable.
What is the difference between utilization and capacity in resource management?
Utilization measures the percentage of a team member's time spent on billable work. Capacity refers to the total available time a team or individual has to work on projects. High utilization isn't always good; it can indicate burnout. Effective capacity planning ensures resources are available without being overstretched.
How can KPIs help reduce project delays?
Tracking on-time delivery rates and cycle times helps identify bottlenecks in the workflow. By analyzing rework rates and their causes, agencies can pinpoint issues with briefs, feedback, or internal processes that lead to delays and implement corrective measures.