Everyone talks about collaboration. It’s the holy grail of modern business, especially for agencies and in-house teams juggling multiple stakeholders and complex projects. You hear about 'synergy,' 'cross-functional alignment,' and 'breaking down silos.'
And none of that is wrong. But it’s incomplete.
The hard truth is that without the right Key Performance Indicators (KPIs), your collaboration efforts are just noise. You’re busy, but are you effective? You’re talking, but are you making progress?
For enterprise-level operations, where stakes are high and the number of moving parts multiplies, simply *doing* collaboration isn't enough. You need to *measure* it. And not with vanity metrics that make you feel good but don't drive results.
We’re talking about the KPIs that reveal friction, highlight bottlenecks, and ultimately, prove the ROI of your collaborative processes.
1. Project Cycle Time Reduction
This is the ultimate measure of collaborative efficiency. How long does it take to get a project from brief to final delivery, with all feedback and revisions accounted for?
Many teams assume that more communication equals faster progress. Often, it's the opposite.
The Bottleneck is Often Feedback Loops
Long project cycles aren't usually caused by the creative work itself. They're caused by the back-and-forth, the waiting for approvals, the missed comments, and the endless email chains trying to reconcile conflicting feedback.
A long cycle time means:
- Delayed client launches
- Increased resource drain
- Higher potential for scope creep
- Frustrated teams and clients
Tracking the average project cycle time, and then segmenting it by project type or client, can reveal systemic issues in your workflow. Are certain clients or project types consistently taking longer? Why?
Measuring Cycle Time Accurately
To measure this effectively, you need a clear definition of 'start' and 'end.' For example:
- Start: Brief officially signed off and project assigned.
- End: Final asset approved by the client and ready for deployment.
The time between these two points, including all interim reviews and revisions, is your cycle time. A reduction in this metric, year-over-year or quarter-over-quarter, is a direct indicator that your collaborative processes are improving.
2. Revision Round Efficiency
How many rounds of revisions does it typically take to get to a final approved asset? And more importantly, how much time is spent *in* each round?
The assumption: More feedback is always better. The reality: Unstructured, unmanaged feedback is a killer.
The Cost of Infinite Revisions
Every revision round adds time, cost, and complexity. If your team is consistently going through 5, 10, or even more rounds on standard deliverables, something is fundamentally broken in the feedback process.
This often points to:
- Lack of clear initial briefs
- Ambiguous or subjective feedback
- Too many cooks in the kitchen (unmanaged stakeholders)
- Lack of a defined approval process
Measuring the average number of revision rounds and the average time spent per round is critical. A decrease here suggests that feedback is becoming more consolidated, actionable, and decisive.
Actionable Feedback Rate
A more advanced metric within this category is the 'Actionable Feedback Rate.' This involves assessing the feedback received in each round:
- Actionable: Clear, specific requests that can be implemented directly.
- Non-Actionable: Vague comments ('make it pop'), conflicting opinions, or requests that fundamentally change the brief without discussion.
A higher actionable feedback rate means your clients or internal stakeholders are providing clearer direction, leading to fewer, more productive revision cycles.
3. Stakeholder Engagement & Response Time
Collaboration isn't just internal. It's about how effectively you engage with clients and external partners. Are they responsive? Is their input timely?
The common trap: Assuming the client is always the bottleneck. While this can be true, it often masks your own internal inefficiencies in *requesting* and *managing* their input.
The Ripple Effect of Delays
When client feedback is slow, it doesn't just delay one step. It creates a ripple effect:
- Your team sits idle, waiting.
- Project timelines slip.
- Other dependent tasks get pushed back.
- Overall project costs can increase due to extended resource allocation.
Measuring the average response time for client feedback on specific deliverables is crucial. This includes tracking how long it takes for feedback to be provided after a request is sent, and how long it takes for final approvals.
Centralized Communication Wins
Are you relying on scattered email threads, Slack messages, and random calls to get client input? That’s a recipe for disaster and slow response times.
A centralized platform where feedback is consolidated, requests are clear, and deadlines are visible encourages faster, more organized responses. When clients know exactly where to go and what’s expected, they’re more likely to deliver.
4. Quality of Deliverables (Reduced Rework)
This is the ultimate test: Are your collaborative processes leading to better, more accurate, and higher-quality final outputs?
The assumption: More eyes on a project mean fewer errors. The truth: Unmanaged collaboration can actually *introduce* errors.
The Hidden Cost of Rework
Rework is different from revisions. Revisions are part of the creative process. Rework is fixing mistakes, missed requirements, or assets that don't meet specifications due to poor communication or process breakdown.
Tracking the percentage of work that requires rework after final approval is a powerful indicator of collaborative effectiveness. High rework rates suggest:
- Inadequate quality assurance (QA) processes
- Poor understanding of requirements throughout the project
- Lack of a final sign-off protocol that confirms all requirements are met
- Insufficient collaboration between creative, strategy, and technical teams
Reducing rework means less wasted time, fewer frustrated clients, and a stronger reputation for delivering polished, accurate work.
Defining 'Rework'
It’s important to have a clear definition of what constitutes rework. This might include:
- Assets failing QA checks post-approval.
- Client requests for changes *after* final sign-off due to missed requirements.
- Technical implementation issues stemming from unclear creative specs.
A declining rework rate is a strong signal that your collaborative workflow is ensuring clarity and accuracy from start to finish.
5. Team Satisfaction & Burnout Rates
You can’t talk about collaboration KPIs without talking about the people doing the collaborating.
The common mistake: Focusing solely on external client metrics and forgetting the internal team’s experience.
Burnout Kills Collaboration
A team that is overworked, frustrated by inefficient processes, or constantly dealing with unclear feedback will not collaborate effectively. Burnout is the enemy of creativity and efficiency.
Tracking team satisfaction through surveys, and monitoring indicators of burnout like:
- Increased overtime hours
- Higher employee turnover
- Reduced engagement in team meetings
- Complaints about process inefficiencies
…is essential. A healthy, satisfied team is a more collaborative and productive team.
The Link Between Process and Morale
When collaborative processes are smooth, feedback is clear, and approvals are timely, teams experience less stress and frustration. They can focus on the creative work rather than navigating communication chaos.
Improving collaboration KPIs should ideally lead to improved team morale and reduced burnout. If your metrics are improving but your team is suffering, you’re measuring the wrong things or ignoring a critical part of the equation.
Where Revue Fits In
The challenge with tracking these enterprise collaboration KPIs is data collection and visibility. How do you consolidate feedback, track revision rounds, monitor response times, and ensure clear approvals across potentially dozens of projects and hundreds of stakeholders?
This is where a centralized platform like Revue becomes invaluable.
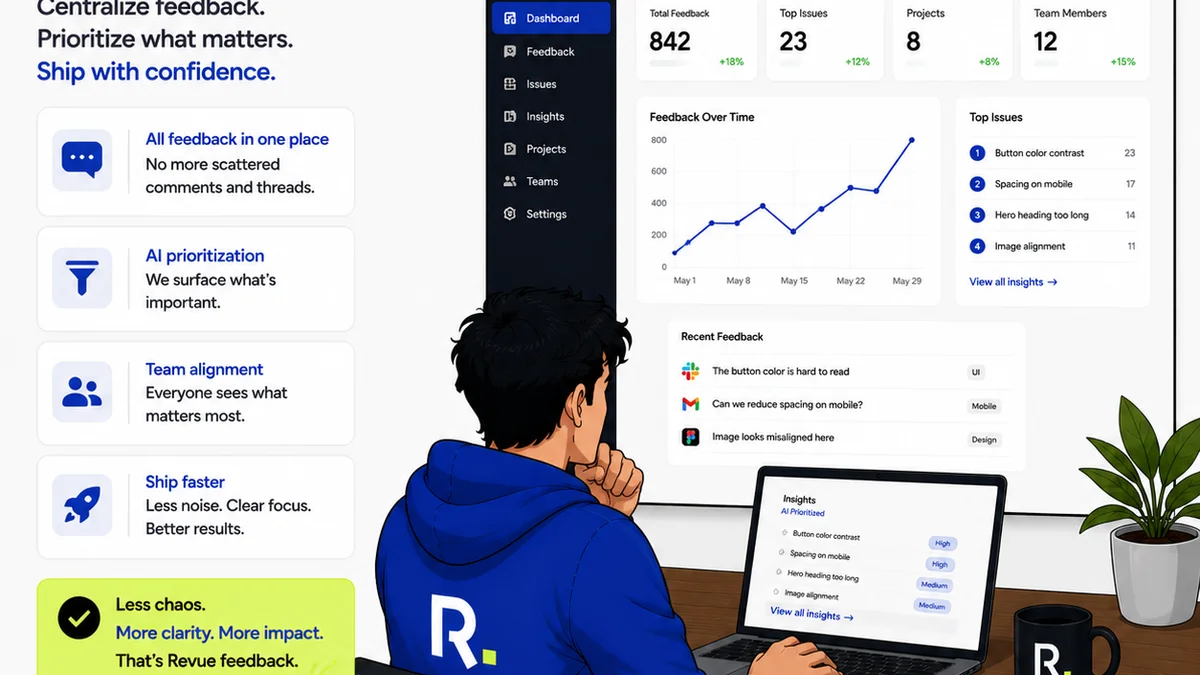
Revue is built to bring order to the collaborative chaos. By centralizing client feedback, managing revisions, and providing clear audit trails for approvals, Revue directly impacts your ability to measure and improve these critical KPIs:
- Project Cycle Time: See exactly when feedback was requested, provided, and approved, eliminating guesswork and identifying delays.
- Revision Round Efficiency: All feedback is documented in one place, with clear version history, making it easy to track the number of rounds and the clarity of feedback.
- Stakeholder Engagement: Centralized communication ensures stakeholders know where to go, reducing response times and providing clear visibility into approval statuses.
- Quality of Deliverables: Clear feedback and approval records mean fewer missed requirements and less ambiguity, reducing rework.
Instead of digging through endless email threads or Slack channels, you have a single source of truth that makes data-driven improvements to your collaborative workflows possible.
Final Thought
Are you measuring collaboration, or are you just measuring activity? The difference is critical for any enterprise aiming for true efficiency and impactful creative output. What’s one collaboration bottleneck in your current process that’s hiding in plain sight?
Frequently asked questions
What are the most important KPIs for enterprise collaboration?
The most important KPIs focus on efficiency and quality, including Project Cycle Time Reduction, Revision Round Efficiency, Stakeholder Response Time, Quality of Deliverables (Reduced Rework), and Team Satisfaction/Burnout Rates.
How can I measure project cycle time accurately?
Define clear start and end points for your projects, such as 'brief signed off' to 'final asset approved.' Track the total time elapsed, including all feedback and revision loops, to identify bottlenecks and measure improvement.
What is 'revision round efficiency' and why does it matter?
Revision round efficiency measures the number of feedback cycles and the time spent in each. Low efficiency indicates unclear feedback, poor briefs, or too many stakeholders, leading to delays and increased costs. Improving it means more actionable feedback and faster approvals.
How does team satisfaction relate to collaboration KPIs?
Team satisfaction and burnout are critical. An overworked or frustrated team cannot collaborate effectively. Smooth, efficient collaborative processes reduce stress and improve morale, directly impacting the quality and speed of work.
How can a platform like Revue help track these KPIs?
Revue centralizes feedback, manages revisions, and provides clear audit trails for approvals. This visibility makes it easier to track project cycle times, revision efficiency, stakeholder response times, and reduce rework, providing the data needed to improve your collaboration KPIs.